

|
|
MangroveMangrove – Outputs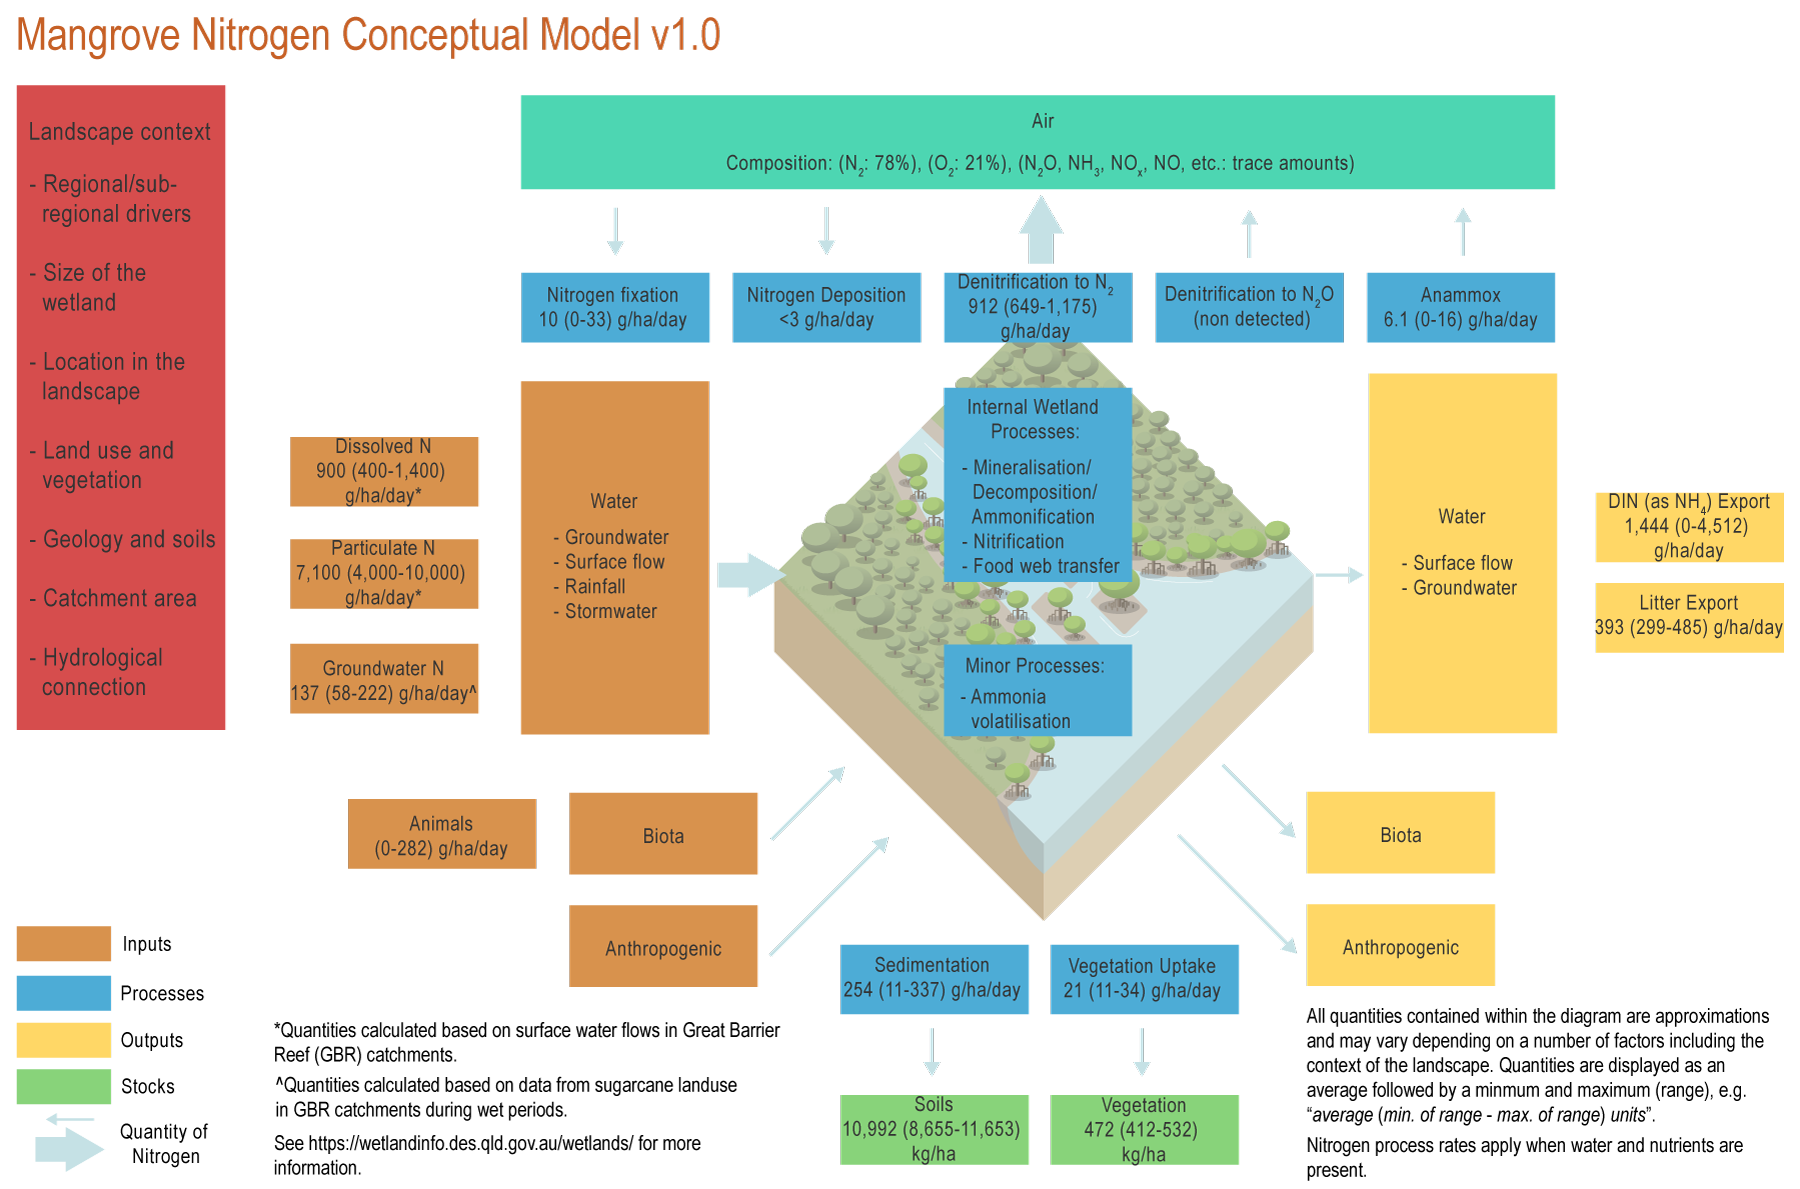
The conceptual models were compiled by researchers in collaboration with a wide range of stakeholders from Natural Resource Management groups, universities and government agencies and based on available scientific information[5]. Click on elements of the model or select from the tabs below AirDenitrification rates in mangroves of the Great Barrier Reef (GBR) catchments are associated with nitrate (NO3) concentrations in the floodwater[3]. Greenhouse gas emissions from mangroves vary depending on nitrogen (N) load, denitrification rates, and temperature. The emissions of N2O are higher where N loads are high, soil carbon and nitrogen are high, salinity is low and temperature is high[7][5]. Mangroves in the Hinchinbrook Channel in Queensland are sinks of 0.5 g/ha/day of N2O[8]. This may be due to low N concentrations in these mangroves. WaterTidal inundationTidal water in mangroves is usually lower in nitrate in the ebb (outgoing) tide compared to the flood (incoming) tide, suggesting removal by the mangroves[1]. However, ammonium (NH4) can be either exported during dry periods (4,512 g/ha/day*) or imported (1,624 g/ha/day*) during wet periods[1][10]. Dissolved inorganic nitrogen (as NH4) is typically output from mangrove systems at 1,444 (0-4,512) g/ha/day*. Vegetated litterExports of particulate N as litter could be substantial with mean values of 393 (299-485) g/ha/day* measured in the Great Barrier Reef region[6][2]. Exports of DON can also occur in mangroves, especially after rainfall events[11]. GroundwaterN transported through groundwater could account for almost half of the N exported from mangroves[10]. Groundwater exports are higher in the wet compared to the dry season. BiotaNitrogen movement from one ecosystem to another can serve a critical link among ecosystems. The transfer of materials across the terrestrial-to-marine boundary is considered to be driven by hydrological connectivity, but animal movement can provide another pathway for nitrogen transfers. This transfer is often highly variable (e.g. seasonal) or localised[9][4]. For example smaller organisms may be consumed by top predators in nearby environments. *Nitrogen quantities are displayed as an average followed by a minimum and maximum (range), e.g. “average (min. of range - max. of range) units”. References
Last updated: 31 July 2021 This page should be cited as: Department of Environment, Science and Innovation, Queensland (2021) Mangrove – Outputs, WetlandInfo website, accessed 8 May 2025. Available at: https://wetlandinfo.des.qld.gov.au/wetlands/ecology/processes-systems/nitrogen-concept-model/mangrove/outputs.html |
Site footer

 — Department of the Environment, Tourism, Science and Innovation