

|
|
River flows (hydrograph)The flow of water in a river channel may sometimes be described graphically using a hydrograph, which simulates discharge over time for a single location. The flow in a channel following a precipitation event (e.g. a storm) is shown on a hydrograph when there is both a quick flow and an underlying baseflow (Figure 1). 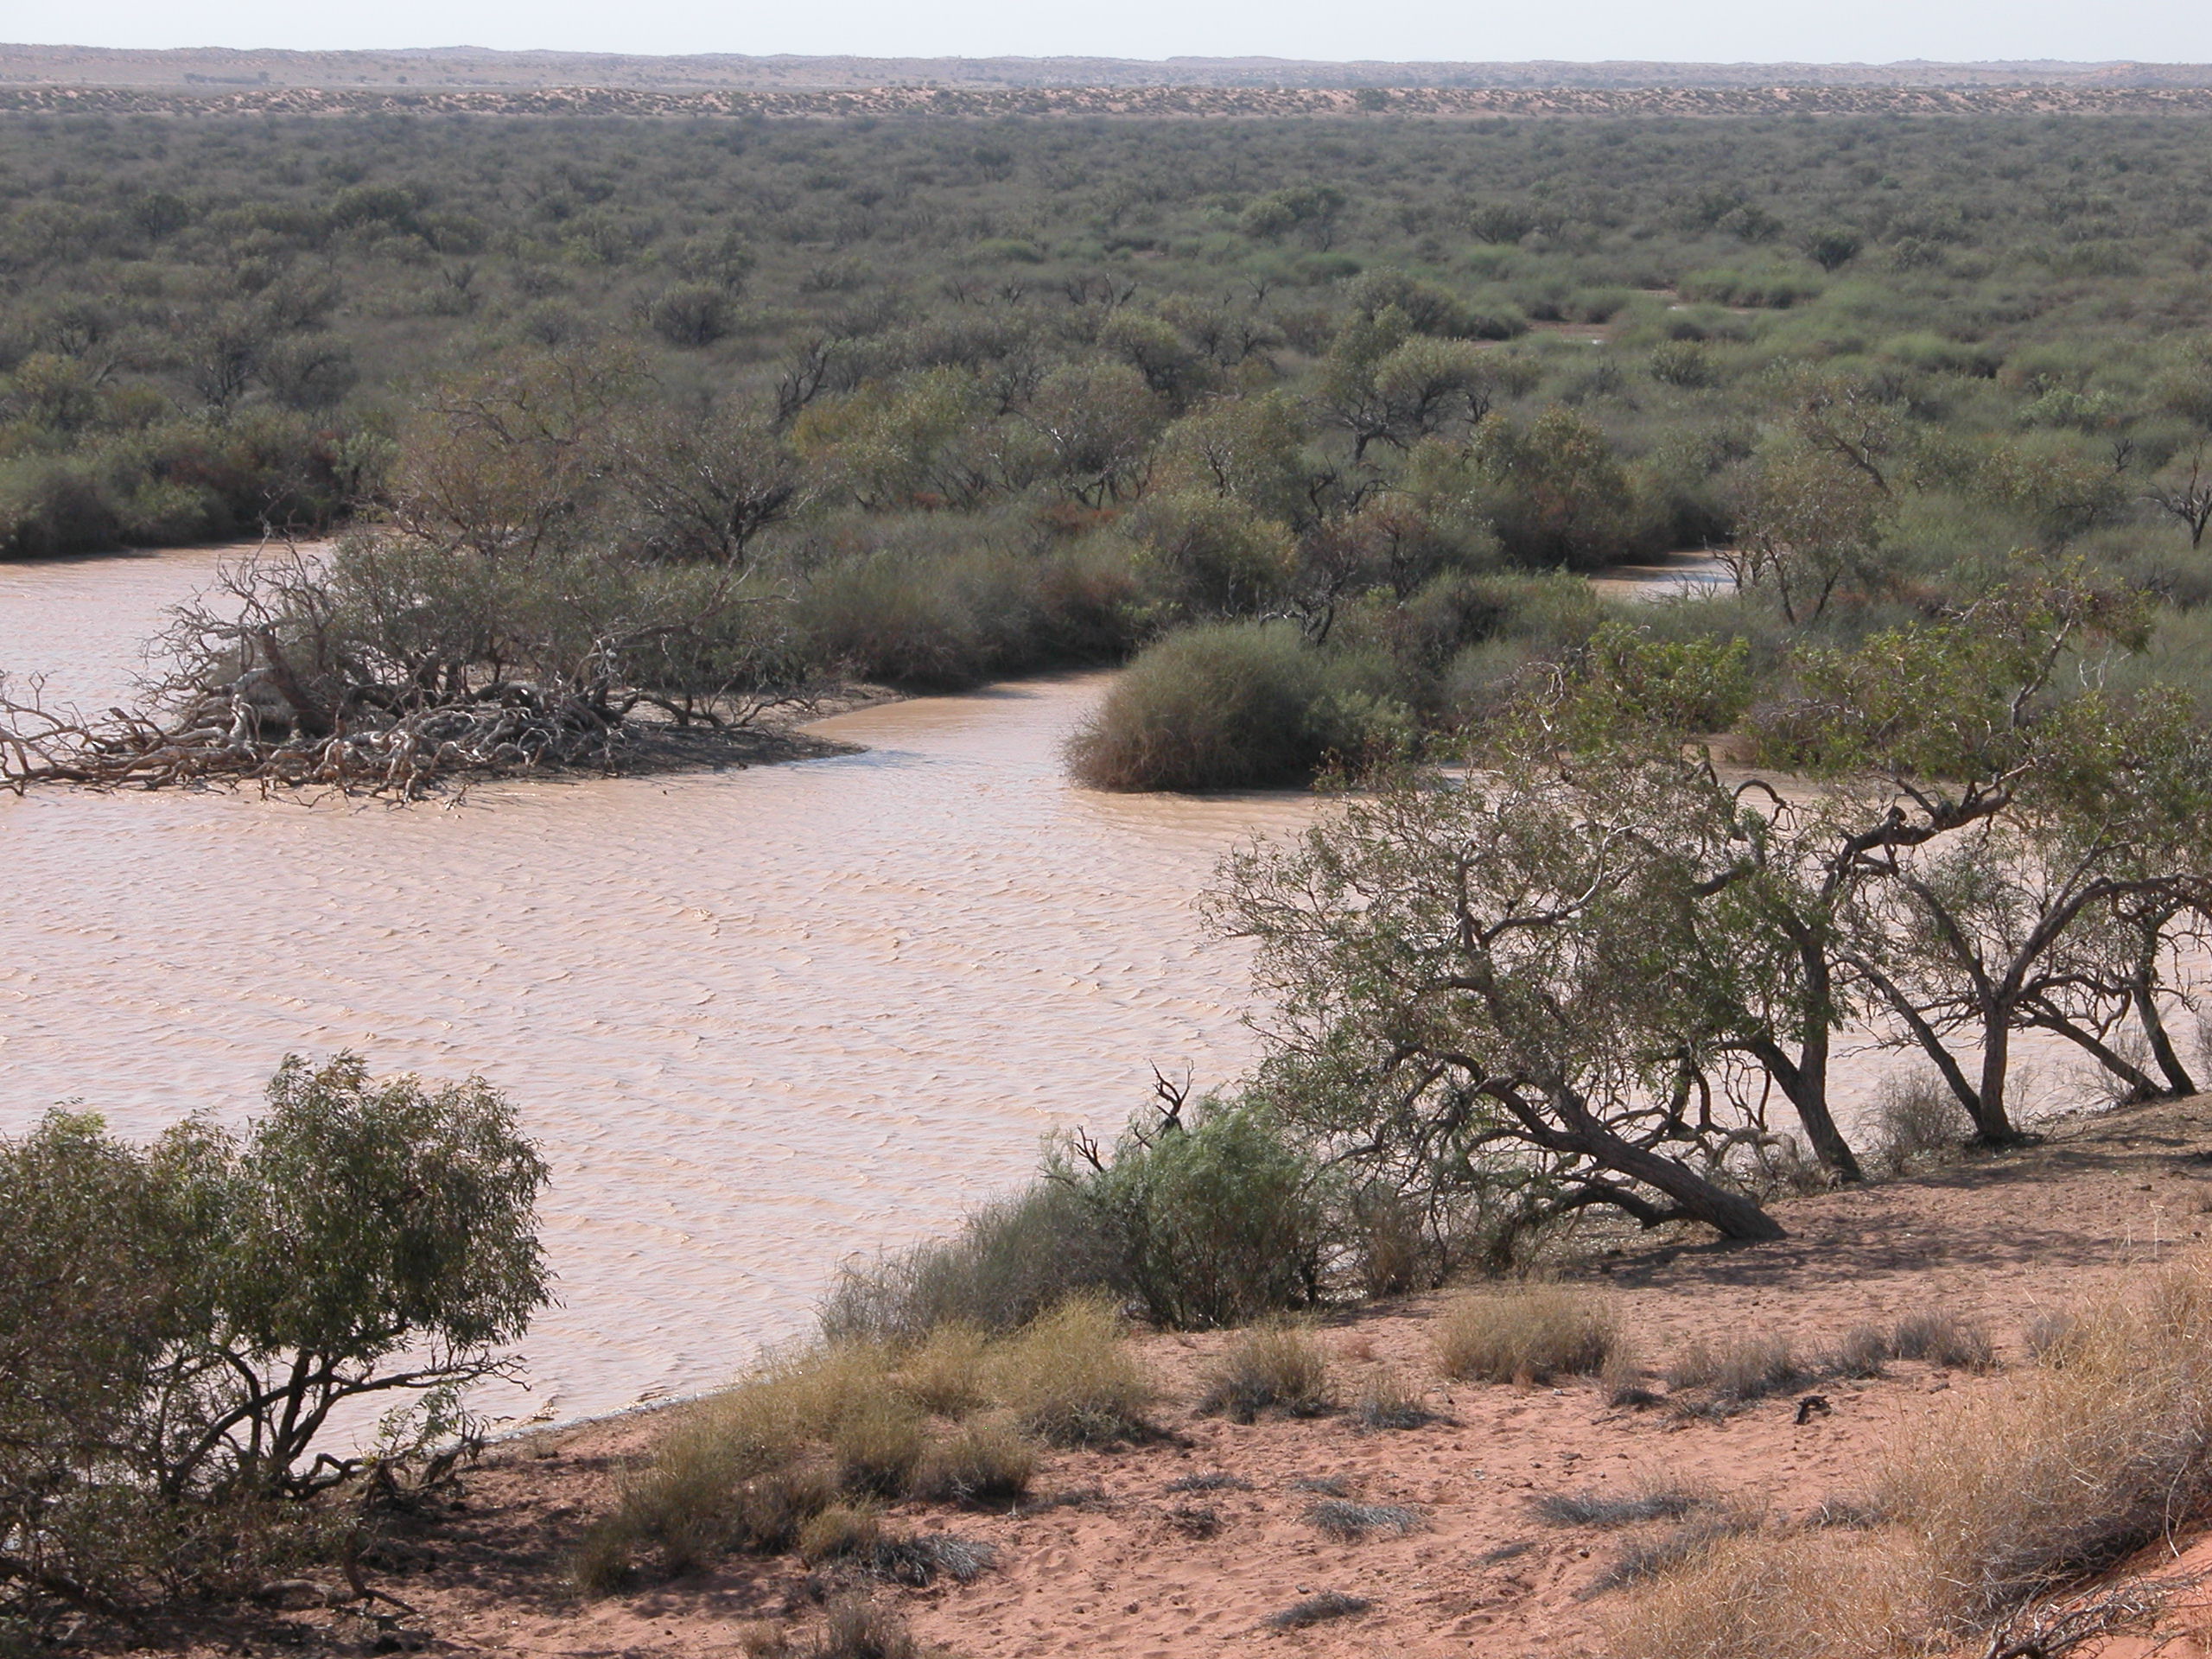 Quick facts
River processes associated with components of a hydrographBaseflowThe initial task in describing a hydrograph is the separation of baseflow from the direct runoff or quick flow. Each discharge monitoring point may have slightly different characteristics from baseflow and quick flow. Historically graphic methods were used to separate the baseflow and often involved using inflection points on the hydrograph slope to denote when quick flow was entering and leaving the hydrograph. More recently statistical approaches have been used to standardise assessments. Baseflow indices can be derived from comparing the volume of baseflow with the volume of quick flow. These indices can help determine how perennial a stream is, or aid in tracking changes associated with hydrological changes such as those that occur as a result of urbanisation. 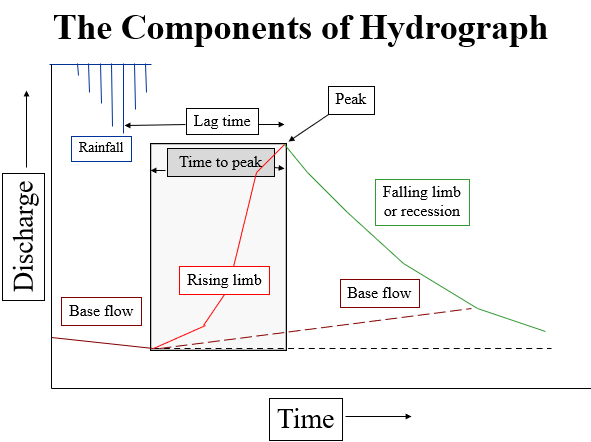 Lag timeThe speed at which the peak flow is reached after a peak rainfall event is an indicator of how ‘flashy’ a catchment is. Short lag times often occur upstream in a catchment, especially when the drainage density (length of streams/catchment area) is high. Lag times are also often short in urbanised environments because stormwater is delivered from impervious surfaces such as roads, roofs and carparks into rivers by a dense network of pipes[5]. In areas with a floodplain and a short lag time flooding may rapidly occur. Overbank flow/flooding and groundwater rechargeA flood occurs when the natural or artificial banks of a waterway are overtopped. When a river floods, the flows rapidly spread over a much greater area than the channel. As the flood extends out of the channel the water depth on the floodplain is much lower compared to that in the channel. This results in the roughness of the ground surface being much higher relative to the channel, causing the water velocity to reduce. The result is that flows on the floodplain tend to be slower moving and have a longer time to infiltrate into the ground. Bank storage/rechargeWhen a high flow or flood is maintained at a site in a river channel, water can infiltrate into the riverbank and recharge local groundwater[1]. The rate of infiltration will depend on the depth of water in the channel, the length of time the water is in contact with the riverbank, the slope of the bank, and the hydraulic conductivity of the riverbank sediment. Table 1. Definitions of a hydrograph
Flood recessionThe rate of flood recession is controlled by the catchment characteristics, with slower rates occurring in downstream areas of large catchments, where the water is slower moving. The rate of flood recession can be important as a trigger for some fish species to exit the floodplain, spawn, or for the dispersal of juveniles[4]. As the flood recedes, the water in the channel that was abutting the riverbank is removed. Depending on the hydraulic conductivity of the banks and the rate of hydrograph recession, the riverbank may be left saturated and relatively heavy. This can lead to mass failures or slumping. In the Lockyer Creek and Brisbane River the high rate of return flow from the bank storage and groundwater recharge combined with flow confinement by the layering of sediment meant that the riverbanks collapsed after wet flows[2] Flow velocity in the river channelThe discharge in any part of a channel is the volume of water moving over a given time period. In order to generate the discharge, the volume of the water needs to be determined. The boundary of the river channel provides resistance to the flows and hence the flows are slower where the water is in contact with the bed and banks of the channel. The same is true to a lesser extent where the water surface meets the air and so the water is slightly slower on the surface. 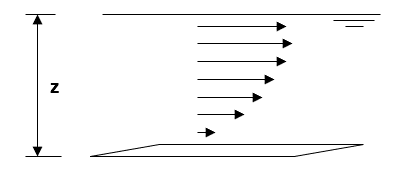 River flows over timeDescribing flood frequencyThe magnitude of a flow event can be estimated based on flow records, modelled data or a combination of both. Often flow records are not sufficient to provide a high degree of confidence in determining how frequently a high flow or flood may occur. The Annual Recurrence Interval (ARI) can be used to describe flow frequency. This is the expected time that will pass before another event of the same magnitude will occur. A one in a hundred-year event (1 in 100) has the probability of occurring every 100 years, but in reality, two or more may occur in the same year. Another way of describing flow frequency is the Annual Exceedance Probability (AEP). This uses the flow record to determine the probability of a flow of a certain discharge or higher occurring within a year. A one in a hundred-year event will have the annual chance of 1 in 100 of occurring and, therefore, it has an AEP of 0.01. Annual flow regimesThe climate can have a major effect on the timing of high, low or no flow events in a river channel, across the year. Temperature dominated river regimes occur in areas where there is snow or ice in the catchments that melts during warmer summer temperatures, such as in high altitudes or latitudes. Winter flows may be non-existent or low but there will be a dominant summer melt peak and then a reduction as the temperatures fall in the autumn, or the supply has been exhausted. Rainfall dominated river flow regimes show a greater correlation between rainfall and river flows than in the temperature dominated regimes. For example, monsoonal river flows are controlled by the movement of the inter-tropical convergence zone causing periods of very high and low rainfall, resulting in a dramatic change in river flows across the year. The rainfall in some regions of Queensland can also be controlled by interactions between the atmosphere and oceans such as the El Niño – Southern Oscilliation (ENSO). These can cause relatively wet or dry years which result in years dominated by floods or droughts. Flow components over a yearThe hydrological cycle of a river channel can be described in terms of the different flow periods over a year and are outlined in Table 2. 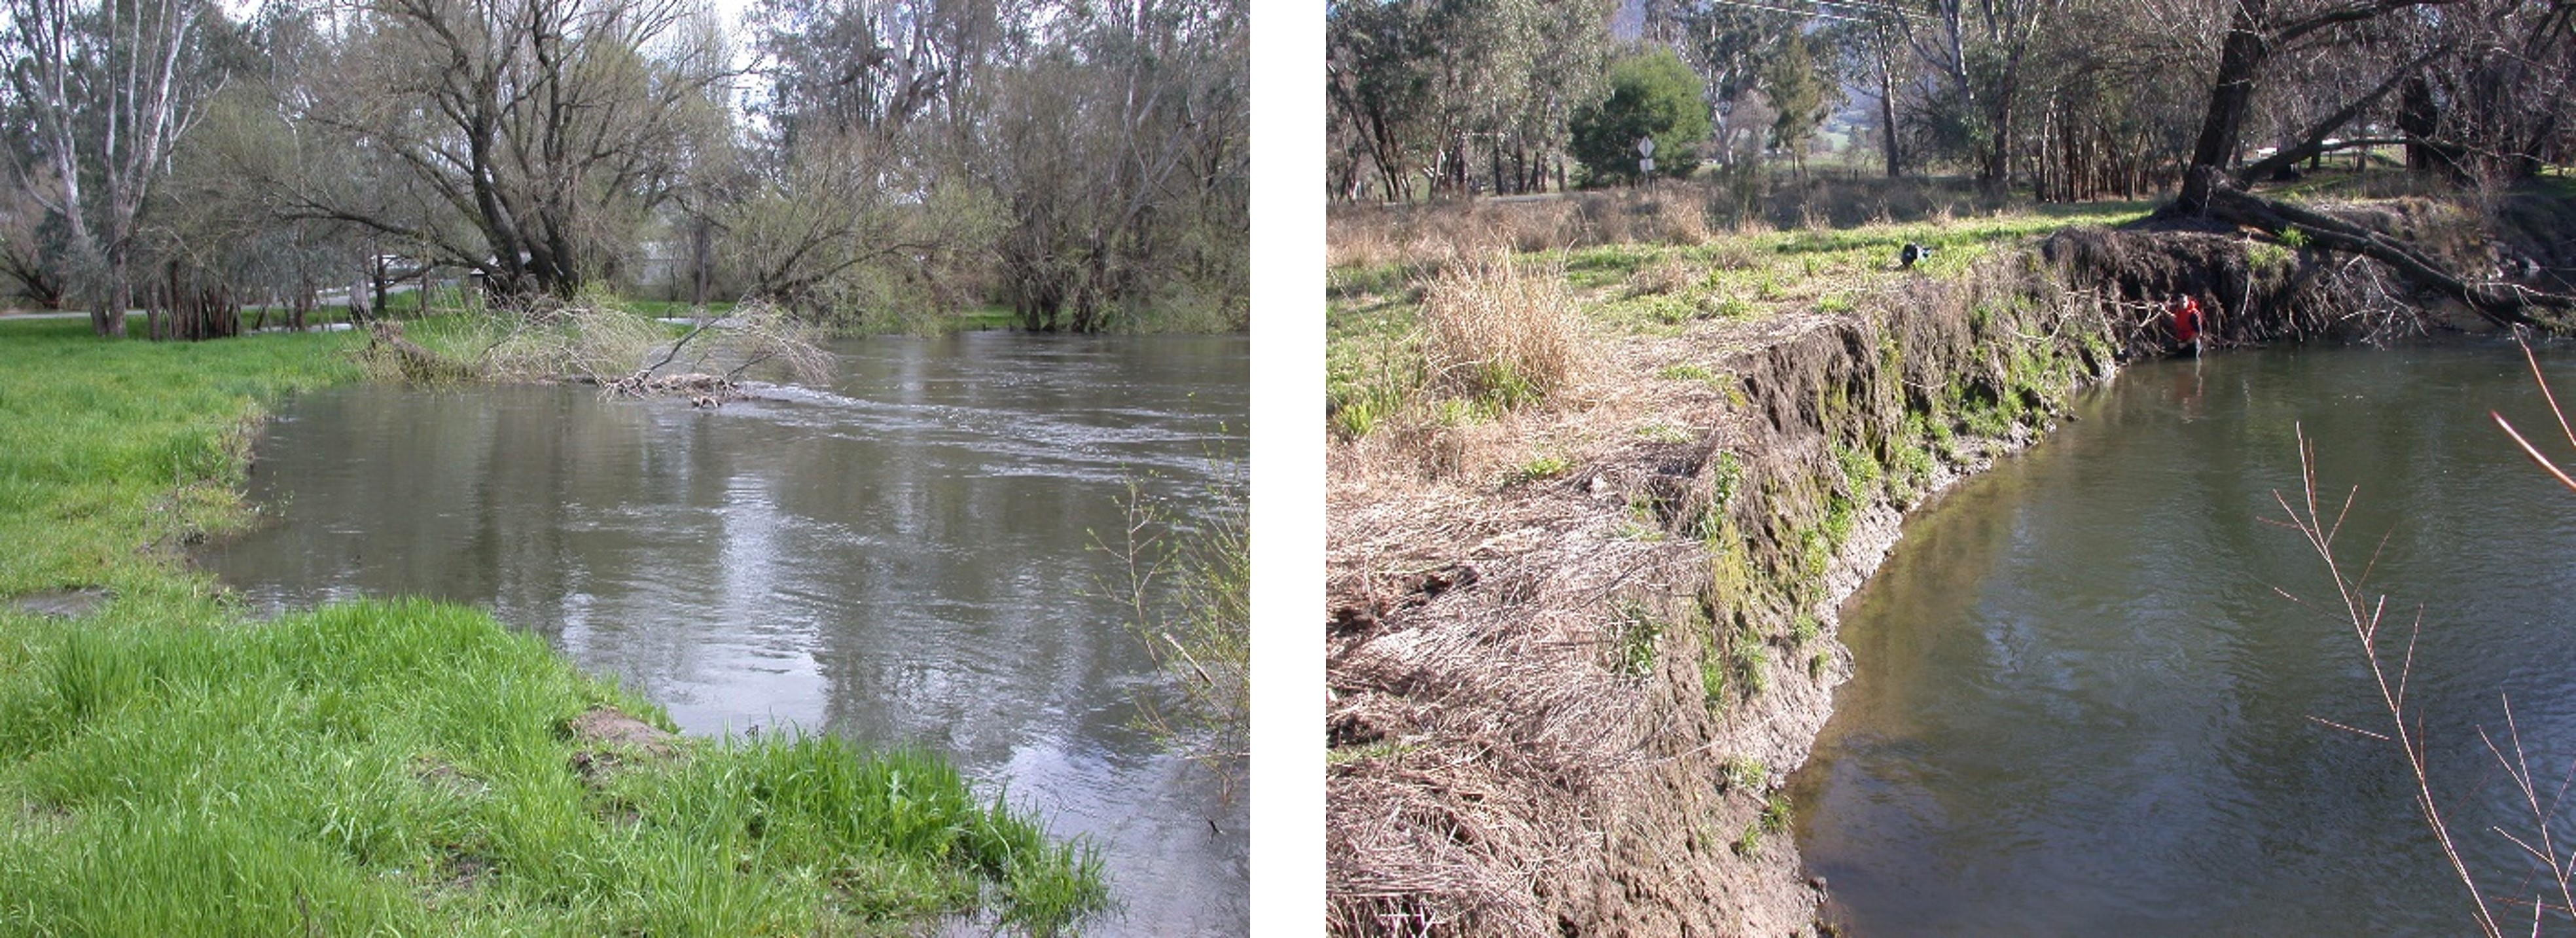 Table 2. A summary of key features of flow components over a year (adapted from DEPI 2013)
The distribution of different flow periods over time is difficult to determine from a flow duration curve. This has led to the development of flow spells analysis by the UK Institute of Hydrology[3]. In the flow spells analysis, a threshold flow is set and the timing of periods above and/or below this threshold are calculated. If the length of time of low flows is of concern, a threshold may be set and the spells lower than this discharge determined. The spell duration, or length of time the river is continuously below the threshold can be reported. The spell deficit can also be reported, this is the volume of water that would be required to keep the stream at the threshold. The thresholds set for spells analysis may be determined by different habitat requirements of certain species. For example, fish may require a certain spell to spawn, and another to migrate. These requirements can then be used to tailor environmental flows for different rivers. ReferencesDepartment of Primary Industries. 2013. FLOWS – a method for determining environmental water requirements in Victoria: Edition 2. East Melbourne, Australia. Doble, R., Brunner, P., McCallum, J., Cook, P. 2012. An analysis of the effect of river bank slope and unsaturated flow in the bank storage process. Ground Water. 50(1), pp.77-86. https://doi.org/10.1111/j.1745-6584.2011.00821.x Gordon, N.D., McMahon, T.A., Finlayson, B.L., Gippel, C.J. and Nathan, R.J. 2004. Stream Hydrology: An Introduction for Ecologists. Second Edition. Wiley, Chichester, UK. Grove, J.R., Croke, J. and Thompson, C. 2013. Quantifying different riverbank erosion processes during an extreme flood event. Earth Surface Processes and Landforms, 38(12), pp.1393-1406. Ladson, A. 2008. Hydrology: An Australian Introduction. Oxford University Press, Melbourne, Australia. Stuart, I.G., and Sharpe, C.P. 2020. Riverine spawning, long distance larval drift, and floodplain recruitment of a pelagophilic fish: A case study of golden perch (Macquaria ambigua) in the arid Darling River, Australia. Aquatic Conservation: Marine and Freshwater Ecosystems.30: pp.675– 690. https://doi.org/10.1002/aqc.3311 Walsh, C.J., Fletcher, T.D., and Burns, M.J. 2012. Urban Stormwater Runoff: A New Class of Environmental Flow Problem. PLoS ONE 7(9): e45814. https://doi.org/10.1371/journal.pone.0045814 References
Last updated: 6 June 2022 This page should be cited as: Department of Environment, Science and Innovation, Queensland (2022) River flows (hydrograph), WetlandInfo website, accessed 8 May 2025. Available at: https://wetlandinfo.des.qld.gov.au/wetlands/ecology/processes-systems/water/river-processes/river-flows/ |
Site footer

 — Department of the Environment, Tourism, Science and Innovation