

|
|
MangroveMangrove – Inputs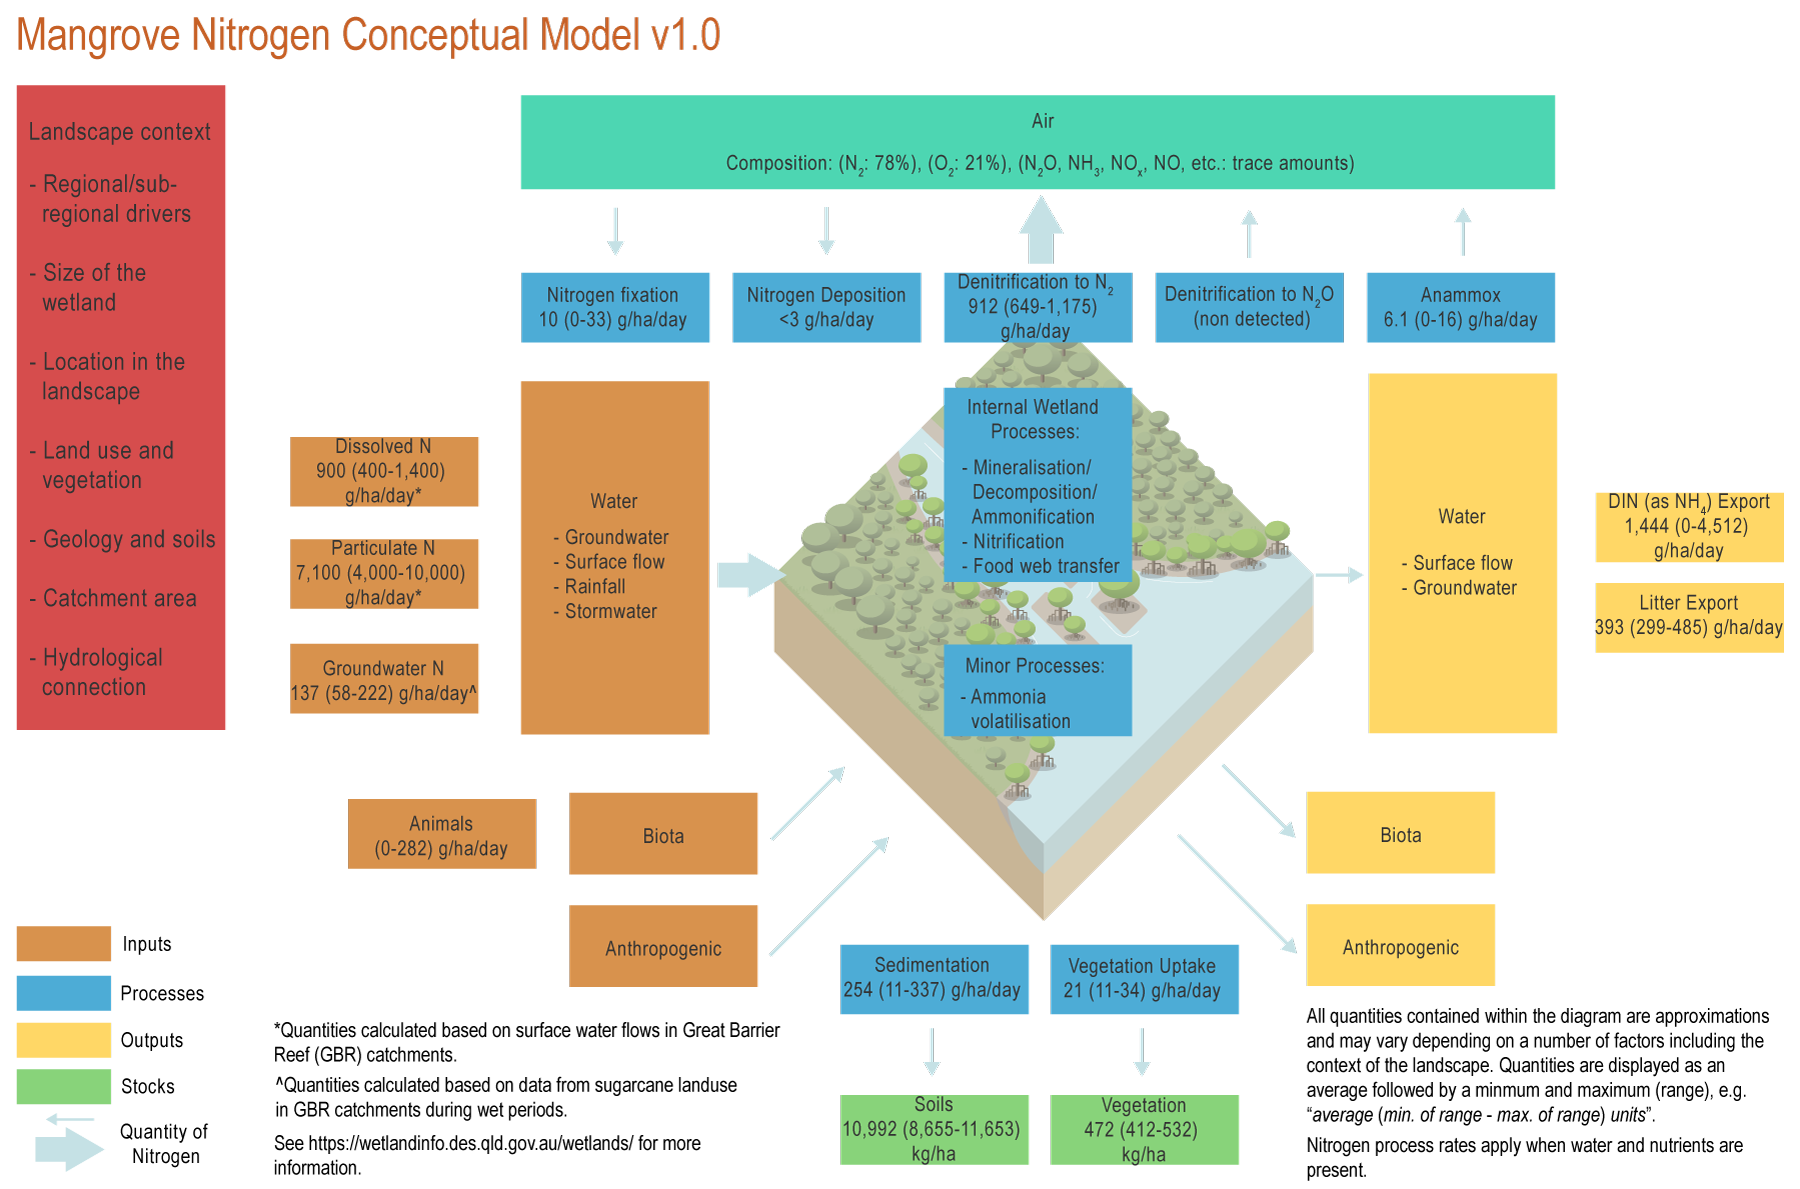
The conceptual models were compiled by researchers in collaboration with a wide range of stakeholders from Natural Resource Management groups, universities and government agencies and based on available scientific information[5]. Click on elements of the model or select from the tabs below InputsInputs of nitrogen to mangrove systems come from a variety of sources and depend on where the system is in the landscape. The general sources and inputs may be found in the pressure pages and are listed below. Some information relating specifically to mangroves is listed on this page. GeneralMangrove specificDuring dry periods, most N in mangroves is delivered through tidal and groundwater flows, while during wet periods, nutrients are also delivered through surface runoff. Mangroves at the mouth of rivers tend to receive higher N concentrations compared to mangroves in tidal creeks[1]. Typically, inputs of dissolved N into mangrove systems are 900 (400-1,400) g/ha/day*, contributing to a total N input of 7,100 (4,000-10,000) g/ha/day*. Tidal inundationMangroves are characterised by frequent and regular tidal inundation. Different types of mangrove species are adapted to live with different levels of inundation and nutrient concentrations. For instance, Avicennia spp. tend to live where inundation is less frequent and soil nutrients are higher, while Rhizophora spp. is adapted to more frequent inundation and lower nutrient concentrations[4]. Tidal inundation will transport nutrients to the forest as dissolved N but also as suspended sediment[5]. GroundwaterGroundwater inputs (137 (58-222) g/ha/day)* to mangrove forests can be substantial accounting for up to half of the total N delivered to mangroves[5]. BiotaMarine birds can be found in high numbers in mangroves, especially on some small islands in the Great Barrier Reef. These birds can provide patchy but high inputs of organic N, which can be greater than 250 g/ha/day, of which 0-32 g/ha/day* is in the form of NO3[3]. Marine birds can provide N subsidies to mangroves and increase the leaf N content by 25%[2]. *Nitrogen quantities are displayed as an average followed by a minimum and maximum (range), e.g. “average (min. of range - max. of range) units”. References
Last updated: 31 July 2021 This page should be cited as: Department of Environment, Science and Innovation, Queensland (2021) Mangrove – Inputs, WetlandInfo website, accessed 8 May 2025. Available at: https://wetlandinfo.des.qld.gov.au/wetlands/ecology/processes-systems/nitrogen-concept-model/mangrove/inputs.html |
Site footer

 — Department of the Environment, Tourism, Science and Innovation