

|
|
Tidal inundation and tidal planesTidal inundation refers to an area being temporarily submerged by tidal water, that is, subject to regular submersion and emersion due to the influence of tides. The tidal inundation regime is the frequency of tidal inundation and is a fundamental driver of wetland function. Tidal planes are reference planes used to define the height of tides, particularly for the purposes of navigation and mapping. They are based on the average height of the tides at a specific location and can be either semidiurnal (two high tides and two low tides per day) or diurnal (one high tide and one low tide per day)[11].
Quick facts
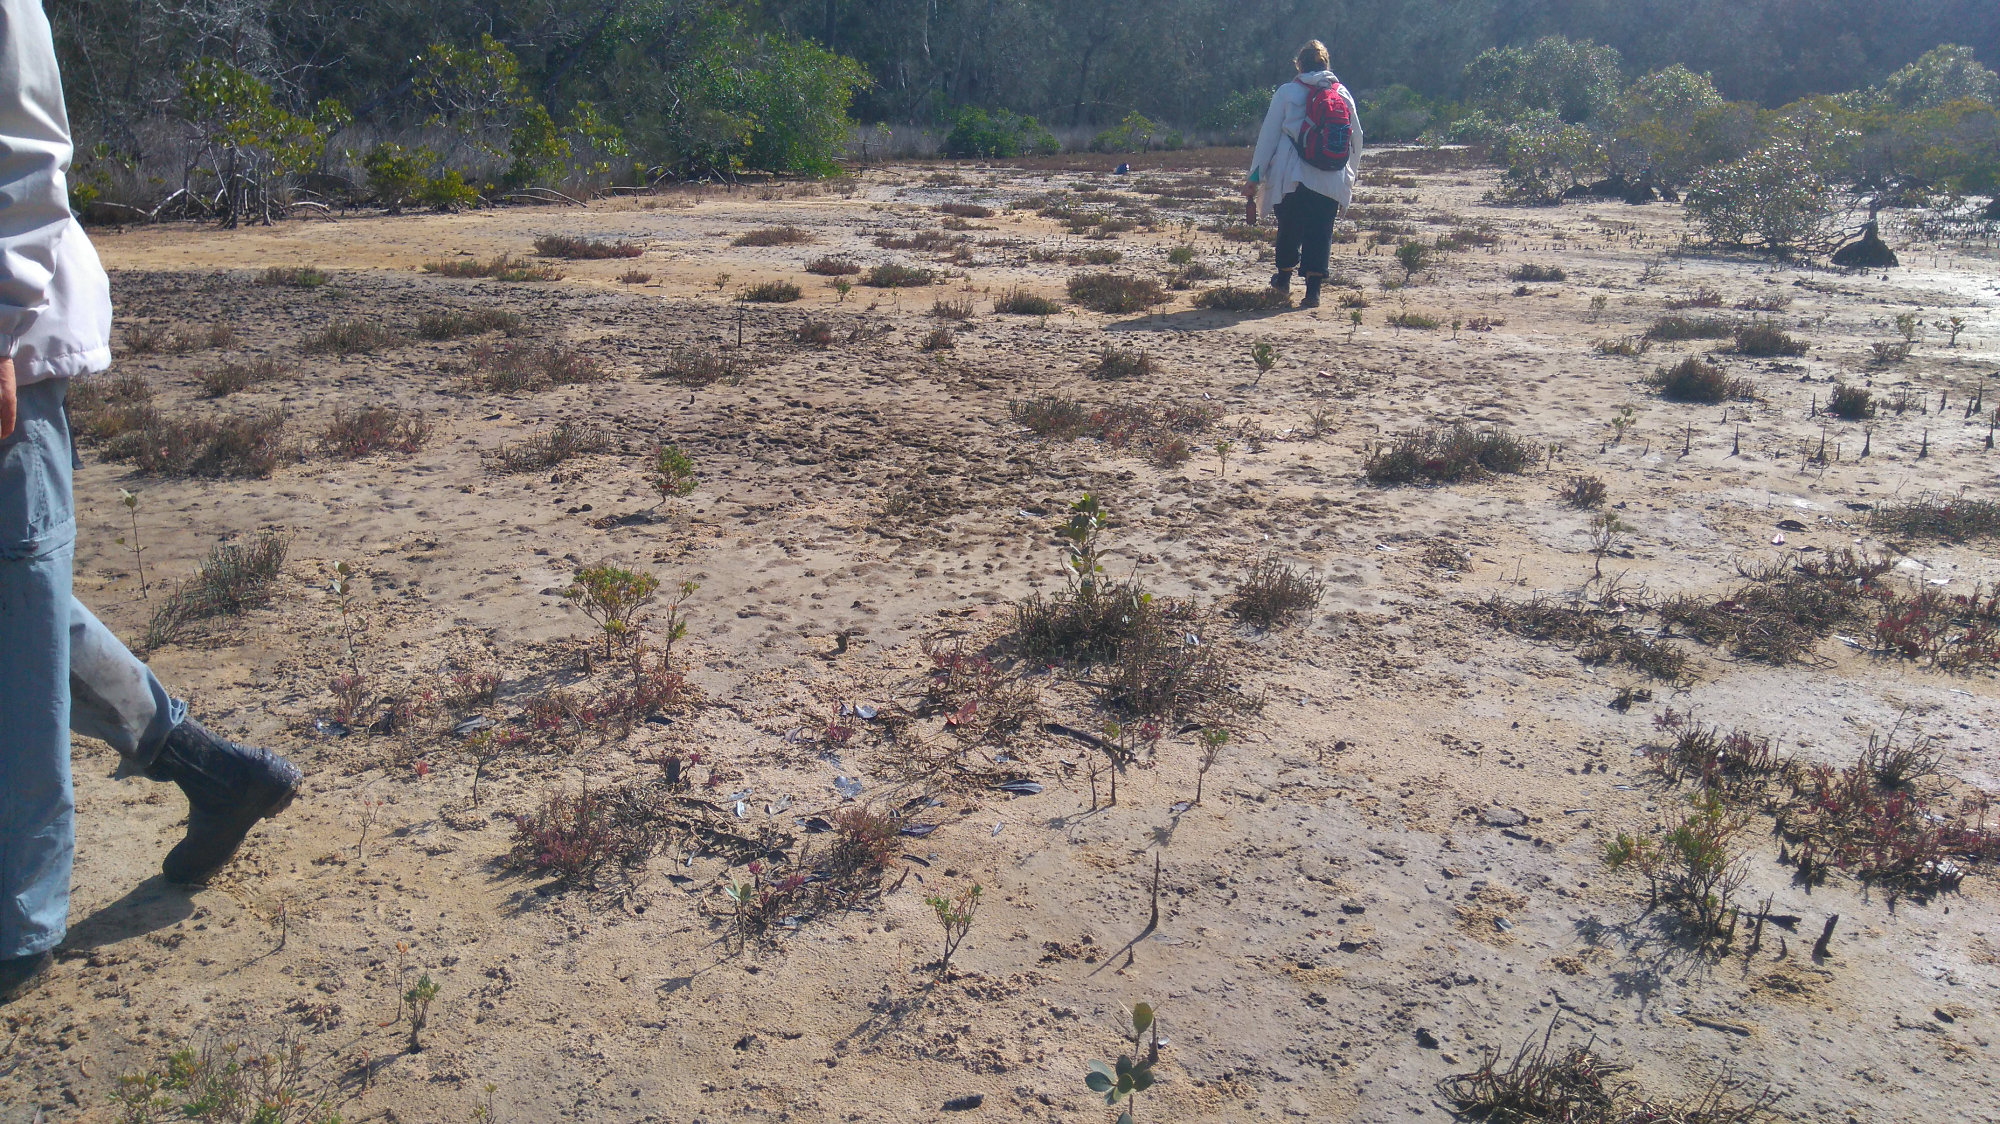
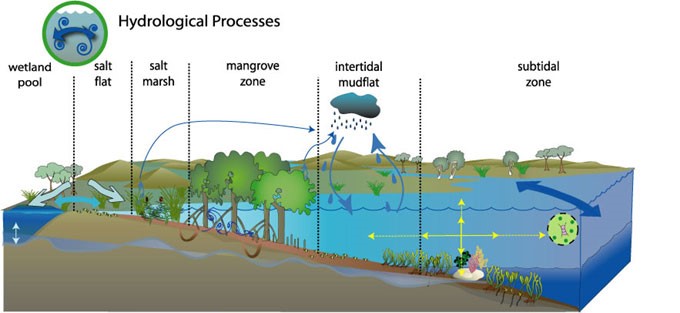
Tidal inundation defines and delineates intertidal and subtidal areas. The intertidal area is between the highest astronomical tide (HAT) and the lowest astronomical tide (LAT) and experiences fluctuating inundation and exposure to air. The subtidal area is below LAT and experiences permanent inundation. The duration and frequency of inundation (e.g. diurnal, weekly, fortnightly, monthly, annual, decadal, episodic) and the spatial extent is important as it may affect desiccation and stress. 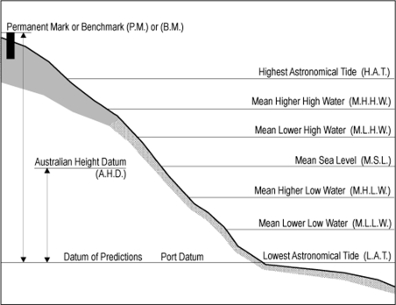 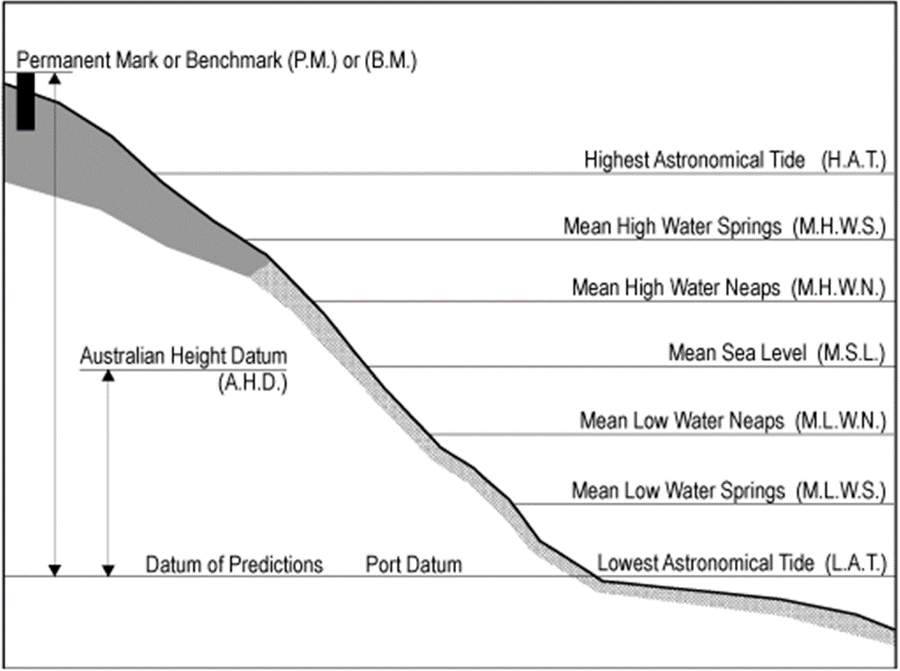 The terms “tidal planes”, “tidal datums”, and “tidal levels” may be used interchangeably, although some draw a distinction - for example, a “plane” implies a two-dimensional surface extending over a given region[5]. A tidal datum plane is a plane of reference for elevations, determined from the rise and fall of the tides. Various tidal planes may be derived, and each is designated by a definite name, as, for example, the plane of mean high water, the plane of half-tide level, the plane of lower low water[4]. Spring tides align to higher and lower tidal planes (at full moon and new moon). Neap tides occur at half moons (e.g. MLWS, MHWS)[12]. Tidal planes are a product of and response to topography. Currently tidal planes are almost impossible to predict at the habitat scale; they are best applied at seascape scales and above. The duration of the tidal cycle changes along the Queensland coast for example, south from Lindeman Island tidal planes are semidiurnal (i.e. usually two high and two low tides each day), whereas in the Torres Strait and the Gulf of Carpentaria tidal planes are diurnal (usually one high and one low tide per day)[7][5]. Although tidal planes can be important legal boundaries, the mapping is often based on models. Biotic patterns are often better indicators of tidal inundation, because inundation determines a range of water and sediment chemical properties that influence biota, e.g. salinity[1] and oxidation-reduction (redox)[2]. Patterns of marine plants can approximate some of the tidal planes. For example, marine plant ecosystems grow below HAT and are mapped as ‘Estuarine’ by the state wetland mapping and as occurring on Land Zone 1 (tidal flats and beaches) in Regional Ecosystem (RE) mapping. Mangroves generally grow above mean sea level (MSL) and species such as marine couch (Sporobolus virginicus) often help to identify the upper tidal limit or Highest Astronomical Tide (HAT). However freshwater influence (either groundwater or riverine) can modify patterns, especially at the upper tidal limits[3]. High tides, storm surges, floods and run-off events periodically connect wetland pools with estuaries, creating important nurseries for fish[10]– see figure below[9]. Tidal influence may also be independent of water salinity as the tidal water moving up and down in the upper estuary (including areas of riverine flow) or in groundwater influenced ecosystems may be fresh water. It may be difficult to determine whether such areas are being tidally influenced or not and for the purposes of classification these areas are categorised as ‘indeterminate’ until otherwise confirmed in the field.
Queensland Intertidal and Subtidal Classification SchemeInundation falls under the 'Hydrology' theme of attributes for the Intertidal and Subtidal Classification Scheme and represents the tidal inundation regime. Modelled HAT surfaces are based on LiDAR. Inundation frequency are based on multiple imagery time series[8]. The spectral bands of light attenuate through the water column exponentially but at different rates depending on the depth or presence of land (various products derive from a 30 year Landsat series of 30m pixel size – seascape scale – produced by: Geosciences Australia[6]; various commercial remote sensing companies). Attribute category table - Inundation
Guide to abbreviations above (e.g. HAT) Additional InformationReferences
Last updated: 16 July 2019 This page should be cited as: Department of Environment, Science and Innovation, Queensland (2019) Tidal inundation and tidal planes, WetlandInfo website, accessed 8 May 2025. Available at: https://wetlandinfo.des.qld.gov.au/wetlands/ecology/aquatic-ecosystems-natural/estuarine-marine/itst/inundation/ |
Site footer

 — Department of the Environment, Tourism, Science and Innovation