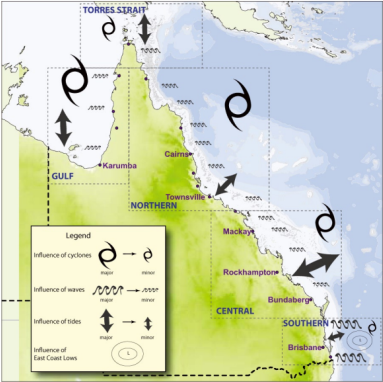
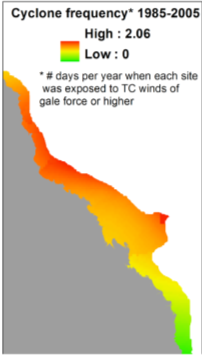
Skip links and keyboard navigation

Energy magnitude

Energy magnitude describes the power of water that shapes the coastline, sea floor and patterns of biota and can be correlated with sediment grain size, e.g. wave energy from cyclones is capable of tossing boulders across the reef crest; cobble and pebble beaches are usually found in areas of relatively higher wave energy.

Water column energy plays an important role in the movement of substrates and geomorphological processes (e.g. erosion and accretion), influencing beach formation[7], estuary configuration (formed through interactions of wave, tide and river energy power)[3][4], shaping geomorphological features of rocky cliffs, platforms and shores[9], coral reefs and lagoons[8][1][2].

Conceptual model of relative strength of energy sources for the Queensland coastline. Image by State of Queensland, 2011

Quick facts

Energy magnitude
is related to the shape of the sea floor, creating ‘sticky water’ which travels slower in areas of high terrain roughness and benthic rugosity, enabling animals such as coral larvae to persist close to their original spawning place[1].

Cyclone frequency from the years 1985-2005. Image by Hill <em>et al</em>., 2012Energy magnitude is especially important for rocky shore biota whose composition is markedly different in the north-east and south-east coasts of Australia in response to contrasting wave energy magnitude[6]. Water forcing transports planktonic larvae and pelagic ecosystems, provides a food source for sessile filter feeding biota[8], and transports water column biota, such as turtles, thousands of kilometres across the ocean.[5]

Energy magnitude is usually modelled in continuous hydrodynamic models, informed by digital bathymetry and other physical factors incorporated into mathematical models (e.g. AusWave, eReefs, BRAN etc.). These models include directionality or vectors, which are not considered in the static attribute of energy magnitude. For classification purposes it is more useful to summarize energy magnitude across time series (e.g. mean, standard deviation, maximum, minimum etc.) such as seasons, years etc. (e.g. eReefs Model) to create static spatial outputs suitable for classification at the required spatial scale (level). Outputs can be split into categories appropriate to that scale (e.g. for seascape and habitat scales the categories of very low, low, medium, high, very high).

Queensland Intertidal and Subtidal Classification Scheme

Energy magnitude is defined, for the purposes of the Intertidal and Subtidal Classification Scheme, as the relative strength of water column energy force, independent of the source of the energy which is a separate attribute of the water column.

Attribute category table - Energy magnitude

Habitat Seascape Subregion Region
Unknown Unknown Unknown Unknown
None None None None
Very low Very low Low Low
Low Low
Medium Medium Medium Medium
High High High High
Very high Very high

Additional Information


References

  1. ^ a b Andutta, FP, Kingsford, MJ & Wolanski, E (2012), '‘Sticky water’enables the retention of larvae in a reef mosaic', Estuarine, Coastal and Shelf Science, vol. 101, pp. 54-63, Elsevier.
  2. ^ Andutta, FP, Ridd, PV & Wolanski, E (2013), 'The age and the flushing time of the Great Barrier Reef waters', Continental Shelf Research, vol. 53, pp. 11-19, Elsevier.
  3. ^ Boyd, R, Dalrymple, R & Zaitlin, BA (October 1992), 'Classification of clastic coastal depositional environments', Sedimentary Geology. [online], vol. 80, no. 3-4, pp. 139-150. Available at: https://linkinghub.elsevier.com/retrieve/pii/003707389290037R [Accessed 12 April 2019].
  4. ^ Dalrymple, RW, Zaitlin, BA & Boyd, R (1 November 1992), 'Estuarine facies models; conceptual basis and stratigraphic implications', Journal of Sedimentary Research. [online], vol. 62, no. 6, pp. 1130-1146. Available at: https://pubs.geoscienceworld.org/jsedres/article/62/6/1130-1146/98405 [Accessed 12 April 2019].
  5. ^ Hamann, M, Grech, A, Wolanski, E & Lambrechts, J (2011), 'Modelling the fate of marine turtle hatchlings', Ecological Modelling, vol. 222, no. 8, pp. 1515-1521, Elsevier.
  6. ^ Poloczanska, ES, Smith, S, Fauconnet, L, Healy, J, Tibbetts, IR, Burrows, MT & Richardson, AJ (2011), 'Little change in the distribution of rocky shore faunal communities on the Australian east coast after 50years of rapid warming', Journal of experimental marine biology and ecology, vol. 400, no. 1, pp. 145-154, Elsevier.
  7. ^ Short, AD & Hesp, PA (1982), 'Wave, beach and dune interactions in southeastern Australia', Marine Geology. [online], vol. 48, no. 3-4, pp. 259-284. Available at: https://linkinghub.elsevier.com/retrieve/pii/0025322782901001 [Accessed 12 April 2019].
  8. ^ a b Wolanski, E (2001), Oceanographic Processes of Coral Reefs. Physical and Biological Links in the Great Barrier Reef, CRC Press, Boca Raton, ed. E Wolanski.
  9. ^ Woodroffe, CD (2002), Coasts: form, process and evolution, Cambridge University Press.

Last updated: 15 July 2019

This page should be cited as:

Department of Environment, Science and Innovation, Queensland (2019) Energy magnitude, WetlandInfo website, accessed 18 March 2024. Available at: https://wetlandinfo.des.qld.gov.au/wetlands/ecology/aquatic-ecosystems-natural/estuarine-marine/itst/energy-magnitude/

Queensland Government
WetlandInfo   —   Department of Environment, Science and Innovation