|
|
MangroveMangrove – Processes
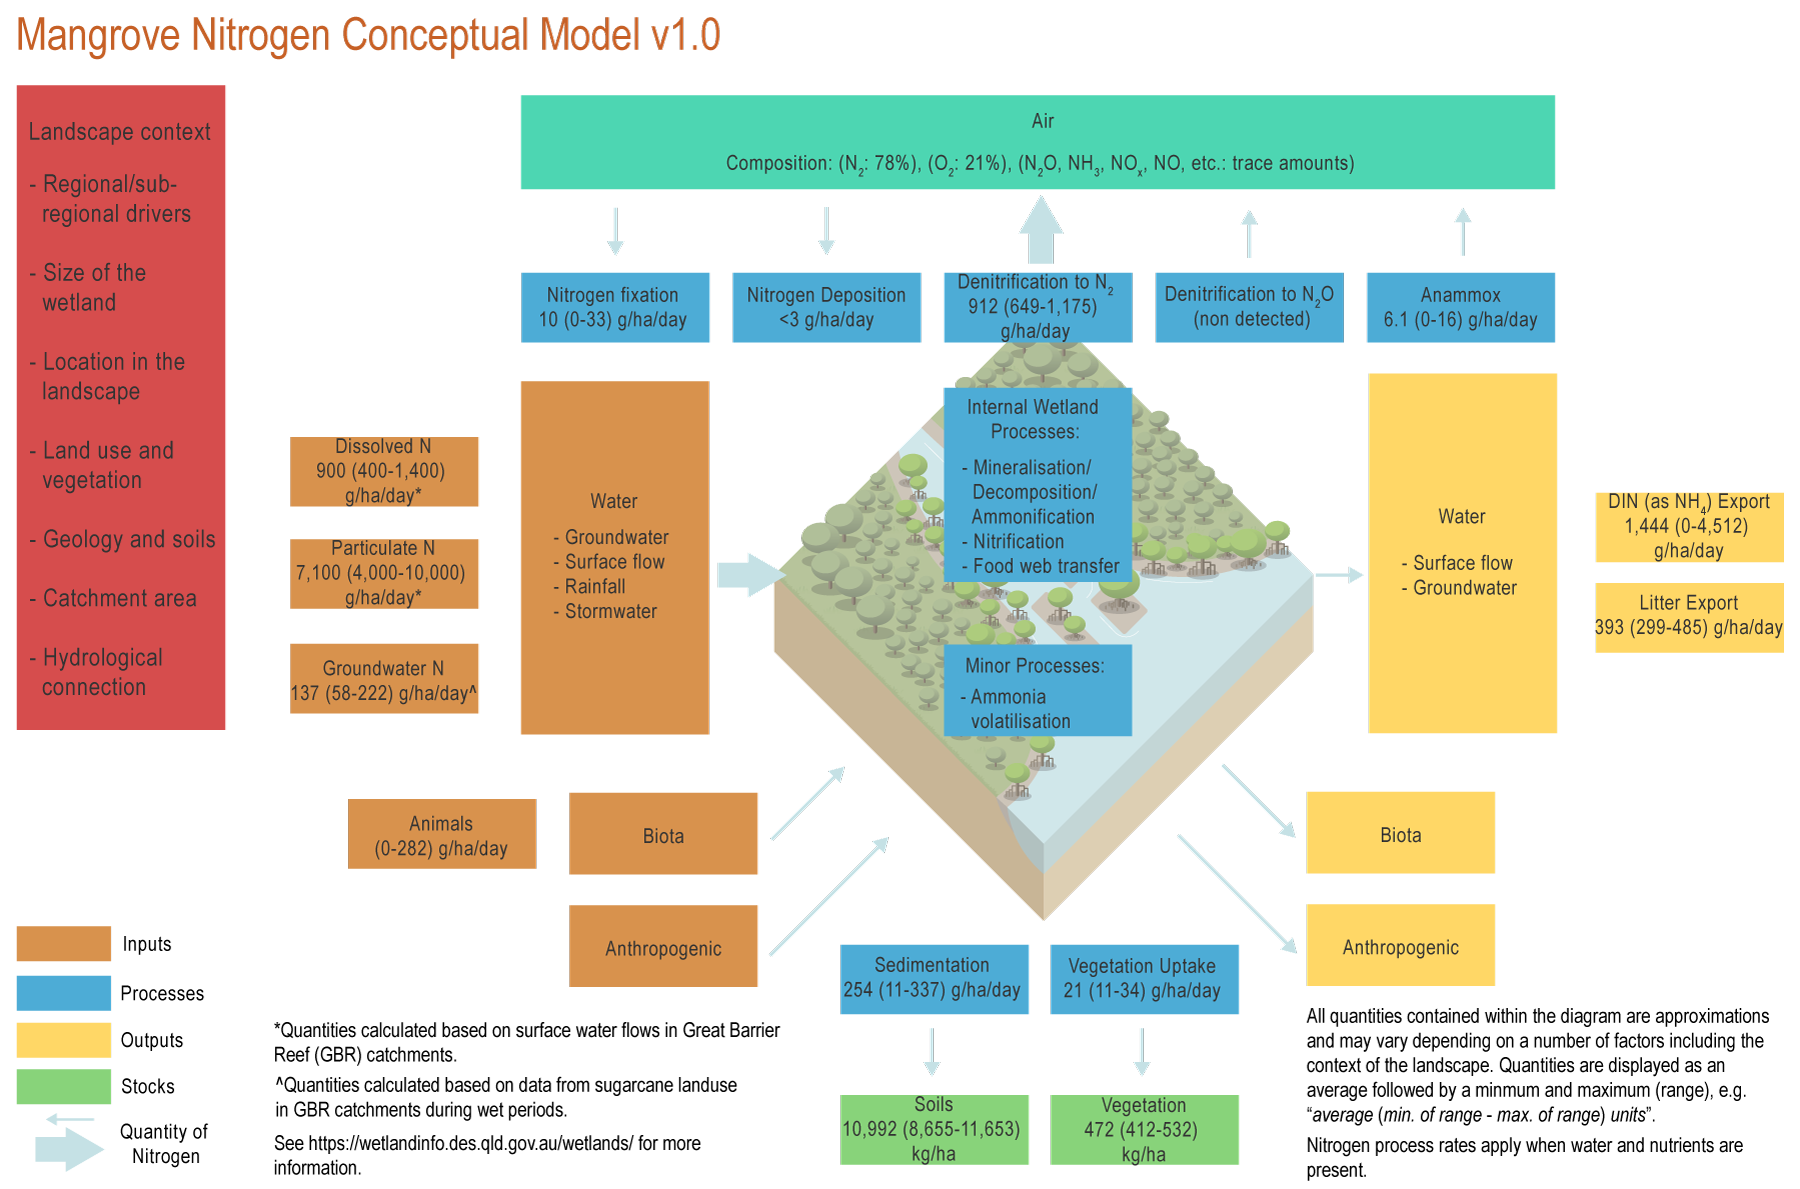
The conceptual models were compiled by researchers in collaboration with a wide range of stakeholders from Natural Resource Management groups, universities and government agencies and based on available scientific information[5]. Click on elements of the model or select from the tabs below Ammonia volatilisationAmmonia volatilisation occurs in basic conditions and where concentrations of urea (derived from animals) are relatively high. In mangrove systems, ammonia volatilization is likely to be minor as soils are usually acidic (less than 7 pH)[1]. AnammoxAnammox can contribute to 3 to 10% of the total NO3 loss in mangroves (6.1 (0-16) g/ha/day)*[9]. The contribution of annamox is higher where oxygen concentrations are very low and soil carbon is high[9]. Biomass accumulation (vegetation)Nitrogen in mangrove wetlands is accumulated in plant material through shrub and tree growth. Tree growth can accumulate between 21 (11-34) gN/ha/day*[5]. Mineralisation (Decomposition/Ammonification)Mineralisation in mangroves has been measured as fluxes of NH4 and NO3, with values of 15 ± 3 g/ha/day for NO3[13]. These values are variable within seasons, but are especially sensitive to increases in N inputs, which can increase these rates 3-9-fold[13]. Ammonification is an important process in mangroves promoted by anaerobic soils[3]. DenitrificationDenitrification rates (912 (649-1,175) g/ha/day)* are likely to be higher during flood events, when NO3 concentrations increase. However, the proportion of NO3 loss in the system due to denitrification could be higher in the dry season as a result of lower water flows[6][17]. Denitrification and anammox are likely to contribute to large NO3 loss in mangrove forests[2]. Dissimilatory nitrate reduction to ammonium (DNRA)DNRA is likely to be an important N pathway in mangroves[11]. The alternation between the two processes of DNRA and denitrification in mangroves could result in an input of NO3 and an export of NH4, especially during the dry season[6][17]. Food chain transferMangroves can sustain some coastal food chains (food webs), through the provision of N in the form of litter, algae growing on pneumatophores, or microbial biomass. The litter, algae and microbial biomass can be directly consumed by organisms within the mangroves, such as crabs or snails[16][15][7]. ImmobilisationImmobilisation (assimilation) in mangroves has been measured as fluxes of NH4 and NO3, with values of 44 (36-52) g/ha/day* for NH4[13]. These values are variable within seasons, and rates may increase similarly to those seen during mineralisation[13]. NitrificationNitrification is limited in mangrove wetlands as conditions in these wetlands are generally anoxic and acidic. If wetlands are polluted and soils become anaerobic (no oxygen), nitrification will not occur, and most N will be in reduced forms (e.g. NH4)[12]. Nitrification is important for denitrification if N inputs are in the form of ammonium, as it transforms the N into the nitrate form required by denitrifying bacteria. Nitrogen deposition from the atmosphereNitrogen can be deposited from the atmosphere to the biosphere as gas, dry deposition and precipitation. However, N deposition is only significant in areas with high industrial activity. In the Great Barrier Reef (GBR) catchments, N deposition is likely to be below 3 g/ha/day[4]. Nitrogen fixation from the atmosphereNitrogen fixation tends to be low in mangroves, especially in sites with high N inputs[14]. In Queensland, N fixation in mangroves has a mean value of 10 g/ha/day, with a range of values from zero to 33 g/ha/day with no clear seasonal pattern[6]. SedimentationMangroves in general have high sedimentation rates. In the Herbert River, in the Great Barrier Reef region, sediments around mangrove forests typically accumulate 254 (11-337) g/ha/day*[8]. Accumulation of sediment, and particulate N, tends to be higher in fringe forests of Rhizophora trees[10]. *Nitrogen quantities are displayed as an average followed by a minimum and maximum (range), e.g. “average (min. of range - max. of range) units”. References
Last updated: 31 July 2021 This page should be cited as: Department of Environment, Science and Innovation, Queensland (2021) Mangrove – Processes, WetlandInfo website, accessed 8 May 2025. Available at: https://wetlandinfo.des.qld.gov.au/wetlands/ecology/processes-systems/nitrogen-concept-model/mangrove/processes.html |

 — Department of the Environment, Tourism, Science and Innovation

