

|
|
Western Cape and Gulf Freshwater Biogeographic ProvinceWestern Cape and Gulf Freshwater Biogeographic Province – Water quality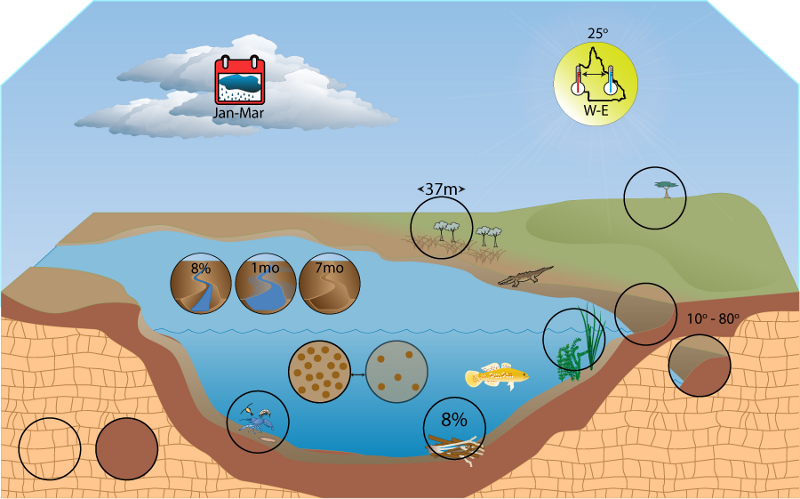 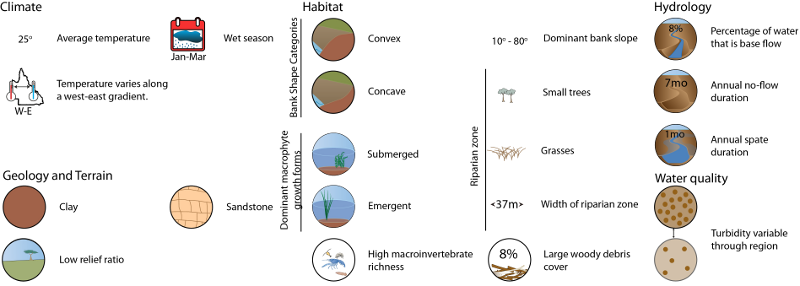 Click on elements of the model or select from the tabs below Turbidity
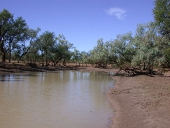
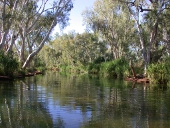
Turbidity is highly variable across the province: at most sites it is low (median of 6), though some areas are highly turbid (pulling up the mean to 51). This effect can also be seen as the turbidity values range from extremely low (minimum of 1) to the extent measurable by the field meters (maximum of 1000). Primary productivity and light climate
*All available field measurements taken from available reference site data from the Aquatic Ecosystem Information System (AQEIS), Department of Local Government, Water and Volunteers, December 2009. Last updated: 22 March 2013 This page should be cited as: Department of Environment, Science and Innovation, Queensland (2013) Western Cape and Gulf Freshwater Biogeographic Province – Water quality, WetlandInfo website, accessed 8 May 2025. Available at: https://wetlandinfo.des.qld.gov.au/wetlands/ecology/aquatic-ecosystems-natural/riverine/freshwater-biogeo/western-cape-and-gulf/water-quality.html |
Site footer

 — Department of the Environment, Tourism, Science and Innovation