

|
|
Western Cape and Gulf Freshwater Biogeographic ProvinceWestern Cape and Gulf Freshwater Biogeographic Province – Climate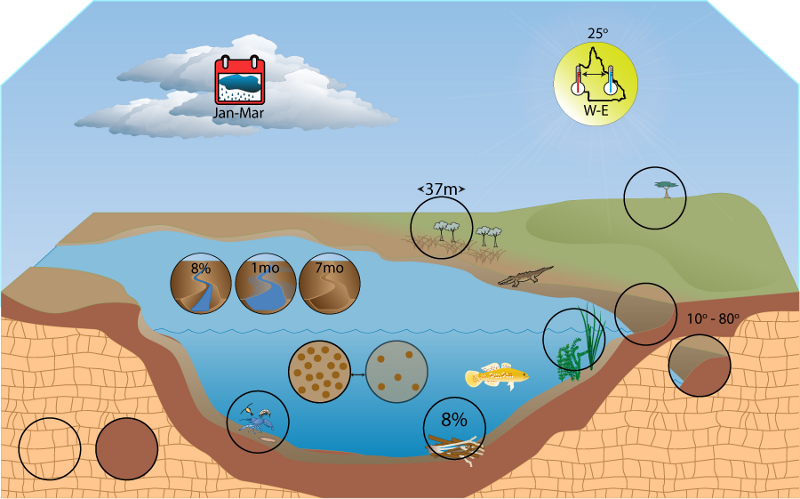  Click on elements of the model or select from the tabs below Rainfall
A north to south gradient exists for annual mean precipitation, ranging from dry to moderate. It forms three bands roughly equating to high rainfall in the tropical north of the Cape York Peninsula, moderate amounts in the centre of the FBP around the Einasleigh Uplands and the least amount of rain occurs in the Gulf Plains and the semi-arid Mitchell Grass Downs in the south of the FBP. Aside from a few small sections on the eastern edge of the FBP, the driest quarter mean precipitation is very dry and homogenous across the FBP. Rainfall erosivity is high overall although it varies across the FBP. Patterns of erosivity correspond closely to annual mean rainfall. As such the areas of highest erosivity are in the north and lowest in the south.
Summary maps of FBP rainfall State rainfall map Temperature
Annual mean temperature for the FBP ranges from hot to cool. Cool areas of the FBP are limited to the south-eastern margin. The highest mean maximum temperature also demonstrates that the hottest temperatures occur in the semi-arid areas of the south-west of the FBP. The ratio of hottest weekly maximum to coldest weekly minimum shows that temperatures tend to be consistent throughout the FBP.
Summary maps of FBP temperature State temperature map
Water balance
Run-off varies across the FBP; mean annual run-off tends to be moderate (2 mm). Spatially, run-off varies with rainfall; it follows a similar north-south gradient, with high run-off at the north of the province to low run-off in the south.
Last updated: 22 March 2013 This page should be cited as: Department of Environment, Science and Innovation, Queensland (2013) Western Cape and Gulf Freshwater Biogeographic Province – Climate, WetlandInfo website, accessed 8 May 2025. Available at: https://wetlandinfo.des.qld.gov.au/wetlands/ecology/aquatic-ecosystems-natural/riverine/freshwater-biogeo/western-cape-and-gulf/climate.html |
Site footer

 — Department of the Environment, Tourism, Science and Innovation