Note that flow in the Western Cape and Gulf Freshwater Biographic FBP is highly variable and the data presented here is averaged across the entire FBP. The variability is most likely primarily driven by climatic effects, e.g. rainfall, which is high in the north and low in the south of the FBP. The result is that the north of the FBP has a relatively perennial flow regime similar to the wet tropics. This contrasts starkly to the south of the FBP, where flow is much more intermittent, and displays similar patterns to semi-arid regions of the state, which are characterised by their boom-bust cycles.
Gauges
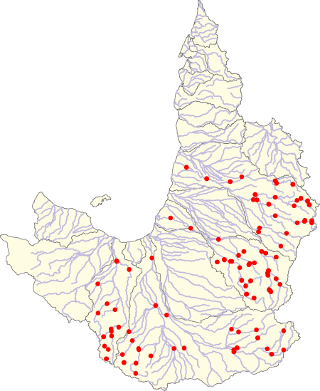
Modelled pre-development data from 61 gauges were used for these analyses. There are no Water Resource Plans currently developed in the Western Cape catchments, and subsequently no modelled pre-development data are available for these areas.
Gauging stations used in calculation of the Western Cape and Gulf FBP hydrological features
917115a
917008a
915204a
913008a
919008
917108a
917009A
915203a
913010a
919005
917106a
917102a
915211a
913007b
919001
917109a
915013a
915209a
919014
919013
917107a
915004a
915206a
919003
919007
917112a
915011a
915212a
919011
917104a
915010a
915003a
919009
917113a
915008a
915207a
919204
917004a
915005a
913009a
919311a
917007a
915014a
913014a
919310
917002a
915009a
913005a
919309
917005a
915012a
913012a
919312
917013a
915210a
913004a
919002
917001d
915205a
913003a
919006
Base flow and flood flow
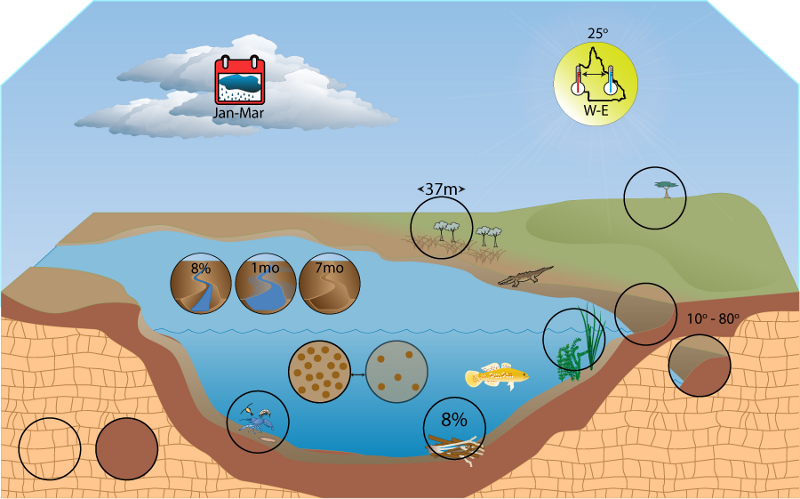
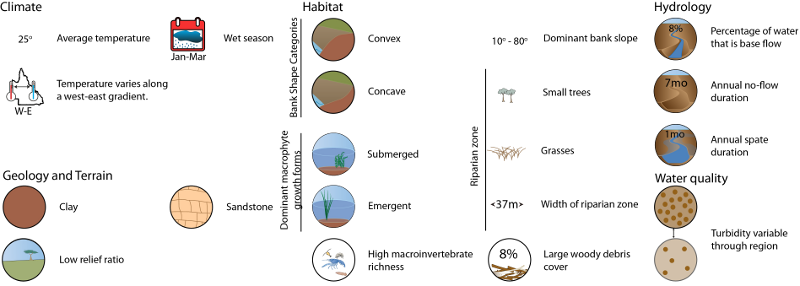
On average approximately 8% of flow (by volume) is base flow and conversely 92% of flow is related directly to flood flow from rainfall events.
Spate run-off averaged 0.012 to 0.014 Ml km2 day-1, these values were relatively steady across the FBP with the highest and lowest values being 0.056 and 0.001 Ml km2 day-1 respectively. There are an average of 4.3 to 4.7 spates per year, with 2.8 to 2.9 of these in the wet season and 1.7 to 1.8 in the dry season. The average duration of spates is approximately 8.6 to 9.2 days.
Flow in the region is intermittent, but frequent. On average, sites in the area spend approximately 60% of the time without flow, though this varies substantially, from 92% to < 1% depending on the site. This again follows a north-south trend. Creeks in the Mitchell catchment towards the north of the FBP have no flow for 28% of the time, those in the Gilbert in the middle of the FBP spend 59% of their time without flow, whilst those in the Flinders and Leichardt catchments have no flow for 85% and 73% of the time respectively.
Periods of flow and no flow tend to cycle relatively rapidly. On average a single no-flow spell lasts for 54 days and sites in the FBP have 4 per year. Duration of no-flow spells ranges from approximately 50 – 58 days. These are separated, on average, by periods of flow which last for 51 – 92 days. Given the general prevalence of periods without flow, aquatic biota be able to either survive in situ, recolonise when flows return, or utilise drought refuges.
The mean rate of rise for the FBP is approximately double the mean rate of fall. The mean greatest rate of rise for the FBP is about 1.5 times higher than the mean greatest rate of fall.
Rise and fall of the hydrograph (per day relative to the mean daily flow)
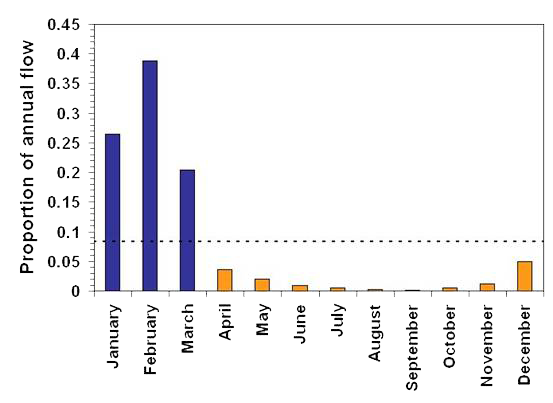
The proportion of flow is heavily biased towards the first quarter of the year. The months January to March have a much greater proportion of annual flow than April to December. Based on this the wet season for the Western Cape and Gulf FBP is January to March and the dry season April to December.
Department of Environment, Science and Innovation, Queensland (2013) Western Cape and Gulf Freshwater Biogeographic Province – Hydrology, WetlandInfo website, accessed 8 May 2025. Available at: https://wetlandinfo.des.qld.gov.au/wetlands/ecology/aquatic-ecosystems-natural/riverine/freshwater-biogeo/western-cape-and-gulf/hydrology.html


 — Department of the Environment, Tourism, Science and Innovation