

|
|
South-East Freshwater Biogeographic ProvinceSouth-East Freshwater Biogeographic Province – Hydrology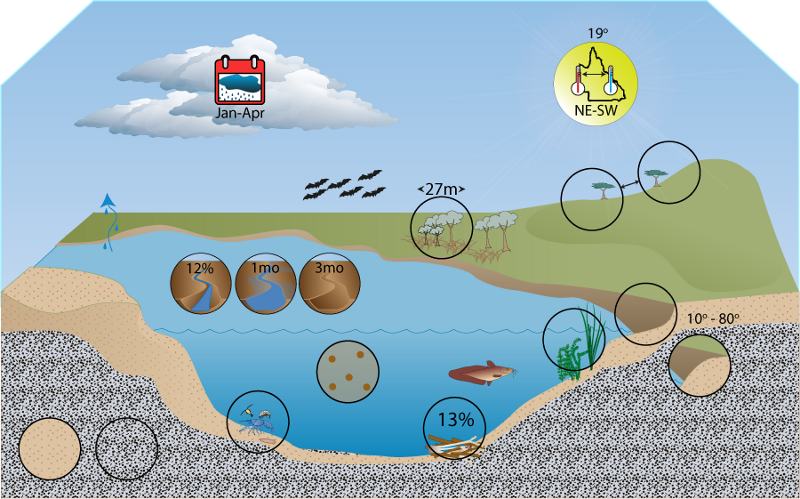 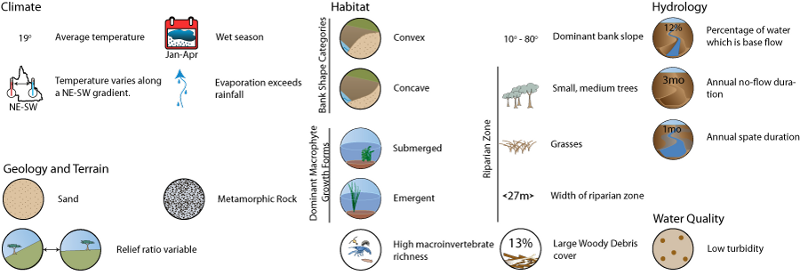 Click on elements of the model or select from the tabs below Gauges
Modelled pre-development data from 52 gauges within the South-East FBP were used for these analyses. Key features of typical hydrographs over multiple temporal scales were used to characterise the following aspects.  State of the Rivers sites used in the calculation of the South-East FBP riparian vegetation features Base flow and flood flowOn average approximately 11% of flow (by volume) is base flow and conversely 89% of flow is related directly to flood flow from rainfall events.
Information about base and flood flow Magnitude of spatesMagnitude of spates averaged 0.7 to 1.1 Ml km2 day-1, but much larger and smaller average values occur within the FBP at particular sites. There is an average of 4.5 to 4.7 spates per year, with 2.5 to 2.7 of these in the wet season and 1.9 to 2.1 in the dry season. The average duration of spates is approximately 8.2 to 8.6 days. The timing of spates is not limited to the wet season so biota that utilise spates for some part of their life history are able to be opportunistic in that they are not confined to do so during only part of the year. The mean number of spates per year in the South-East is high with respect to other FBPs and they are typically shorter in duration. This suggests that the rate of rise and fall of spates is fairly rapid in the South-East. This also implies that spates are a fairly high disturbance to biota in these systems. Information about magnitude of spates
No flow spells83 of the 91 modelled flow sites available experienced periods without flow. Sites in the FBP on average have approximately 5 to 6 no-flow spells per year, each spell lasting on average 10.2 to 12.8 days however at one site in the Brisbane catchment a spell has been recorded lasting up to 77 days. The average longest dry spell in the reporting period is approximately 6 months; however a dry spell of over 3 years has been recorded at one site in the Brisbane catchment. On average there is no flow approximately 22% of the time, but this varies with a maximum of around 80% recorded at one site in the Brisbane catchment. The mean continuous period of flow between no flow spells is 517 days (approximately 17 months), but this can be as long as 21 years, recorded from one site in the Mary catchment, and as short as 7 days, recorded from one site in the Brisbane catchment. The average longest period of flow between no flow spells is approximately 7 years, ranging from 53 years at one site in the Logan-Albert catchment to only 151 days at one site in the Burnett catchment. Given the general prevalence of periods without flow, aquatic biota must have traits enabling them to either survive in situ or recolonise when flows return, or else utilise drought refugia. Persistent waterholes are the most evident form of refugium in the South-East FBP. Given that waterholes connect more frequently in the South-East fauna don’t necessarily need to tolerate conditions as extreme as in other FBPs. Information about no flow spells
Rise and fall of the hydrographThe mean rate of rise for the South-East FBP is approximately three times greater than the mean rate of fall. Similarly, the mean greatest rate of rise for the FBP is almost double the mean greatest rate of fall. Information about the rise and fall of the hydrograph
Wet and dry seasonsThe proportion of annual flow is not evenly distributed between months. The months January through to April have a greater proportion of annual flow than May to December. Based on this, the wet season for the South-East FBP is January through to April, and the dry season May to December. Compare this pattern with the other FBPs. 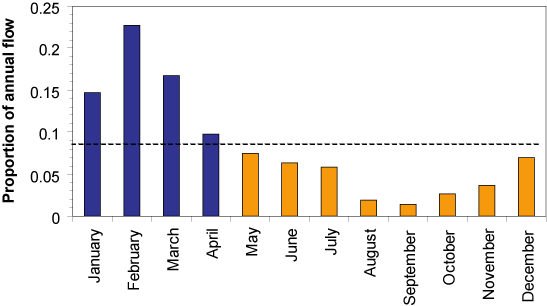 Dotted line shows the mean/median flow Information about wet and dry seasons Last updated: 22 March 2013 This page should be cited as: Department of Environment, Science and Innovation, Queensland (2013) South-East Freshwater Biogeographic Province – Hydrology, WetlandInfo website, accessed 8 May 2025. Available at: https://wetlandinfo.des.qld.gov.au/wetlands/ecology/aquatic-ecosystems-natural/riverine/freshwater-biogeo/south-east/hydrology.html |
Site footer

 — Department of the Environment, Tourism, Science and Innovation