

|
|
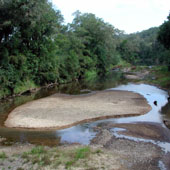
South-East Freshwater Biogeographic ProvinceSouth-East Freshwater Biogeographic Province – Habitat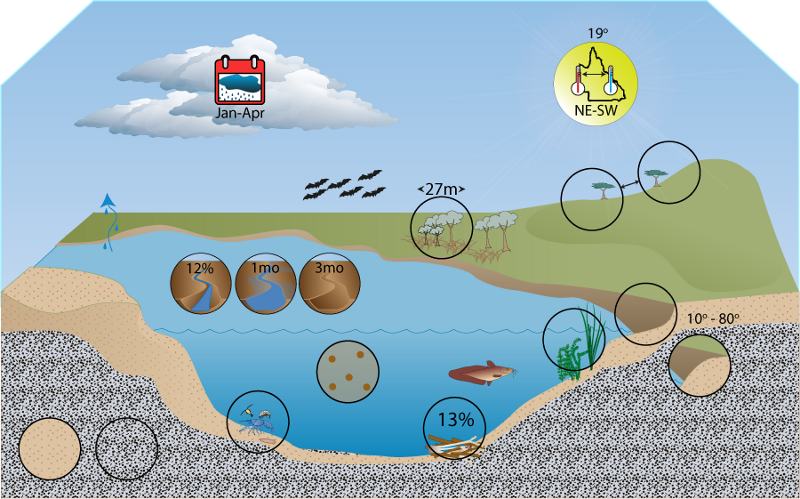 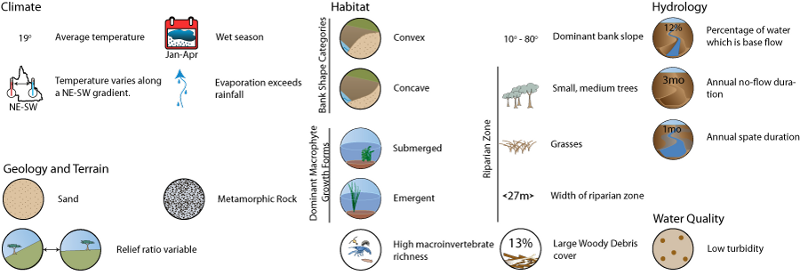 Click on elements of the model or select from the tabs below Bank shape and slope
State of the Rivers survey data from 154 reference sites show that all bank slope categories are present in the FBP and also all represent the are the dominant category at more than 7% of sites. Steep slope is the most commonly dominant category, with moderate and low slope categories are also dominant frequently. All shape categories also occur, but undercut shaped banks occur at less than 10% of sites and are rarely dominant. As in most FBPs, concave and convex bank shapes are the most common and dominant in the South-East.
Information about bank shape and slope
Riparian vegetation and macrophyte (aquatic plant)State of the Rivers survey data from 154 reference sites in the FBP show that the average width of riparian zones is approximately 25 to 30 m. Grasses, medium trees and small tress typically dominate riparian vegetation cover. Trees over 30 m, woody shrubs, vines, rushes and sedges, and herbs and forbs are also present. Tree ferns, ferns, mosses and palms typically form very minor components of riparian cover, but are all typically present. Riparian zones are on average only 9 to 11% bare of vegetation. Riparian zone shading is generally considerable in this FBP.
Information about Riparian Vegetation and Macrophytes
Macrophyte (aquatic plant)Macrophytes were present at only 34% of sites in the South-East FBP. Mean total cover was 9.5 to 18.5%, which is typically dominated by submerged growth forms. Submerged plants provide habitat and food for macroinvertebrates and fish, and are also potential sites for fish egg attachment. Submerged plants are also a substrate for the attachment of epiphytes such as algae. A varied macrophyte composition provides a diversity of habitats for aquatic fauna.
Substrate composition and heterogeneity
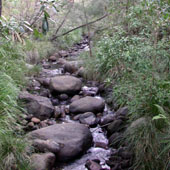
The number of substrate classes recorded from sites in the South-East FBP is high with respect to most other FBPs in Queensland. An average of almost four classes were recorded from edge habitat with a range of one to seven classes. Pool and riffle habitats averaged around 4.5 classes and ranged from one to seven, and two to seven respectively.
Information about Substrate Composition and Heterogeneity
Macroinvertebrate RichnessHigh substrate heterogeneity and the availability of hard substrate is likely to contribute to high macroinvertebrate diversity in the South-East FBP. Table: Results of Pearson’s correlations between substrate heterogeneity and number of substrate classes present with macroinvertebrate sample richness from ABMAP reference sites in the Wet Tropics FBP. Significant p values (<0.05) are indicated in italics.
Information about macroinvertebrate richness Woody debris and snags
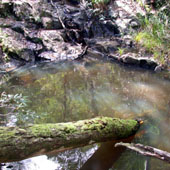
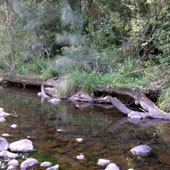
Large Woody Debris (LWD) and snags are conspicuous components of many rivers in the FBP. State of the Rivers survey data from 154 reference sites in the FBP show that on average there are approximately 104 items of LWD and snags per kilometre reach of river and that these cover about 12 to 14% of the river bed. In extreme cases there can be no LWD present, or up to 1200 items per kilometre covering 60% of the bed. Individual logs and branches are more common than snags (log jams and branch piles). Patches of leaf litter and twigs cover on approximately 24% of the stream bed on average, and consist of 80 – 100 patches per kilometre of river. This can range however from no patches per kilometre, up to 600 and 100% bed cover. In many situations within the South-East FBP woody debris is an abundant hard substrate. It is likely to be utilised by many organisms requiring hard substrates for part of their life histories. The high density and coverage of leaf litter suggests it is likely to be an important food source in this FBP.
Information about Woody Debris and Snags
Last updated: 22 March 2013 This page should be cited as: Department of Environment, Science and Innovation, Queensland (2013) South-East Freshwater Biogeographic Province – Habitat, WetlandInfo website, accessed 8 May 2025. Available at: https://wetlandinfo.des.qld.gov.au/wetlands/ecology/aquatic-ecosystems-natural/riverine/freshwater-biogeo/south-east/habitat.html |
||||||||||||||||||||||||||||||||||||||||||||||||||||||||||||||||||||||||||||||||||||||||||||||||||||||||||||||||||||||||||||||||||||||||||||||||||||||||||||||||||||||||||||||||||||||||||||||||||||||||||||||||||||||||||||||||||||||||||||||||||||||||||||||||||||||||||||||||||||||||||||||||||||||||||||||||||||||||||||||||||||||||||||||||||||||||||||||||||||||||||||||||||||||||||||||||||||||||||||||||||||||||||||||||||||||||||||||||||||||||||||
Site footer

 — Department of the Environment, Tourism, Science and Innovation