

|
|
Queensland Murray-Darling Freshwater Biogeographic ProvinceQueensland Murray-Darling Freshwater Biogeographic Province – Hydrology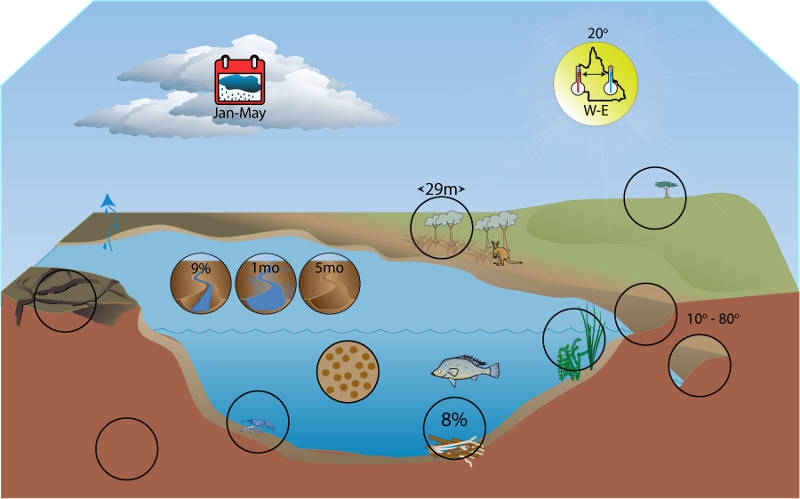 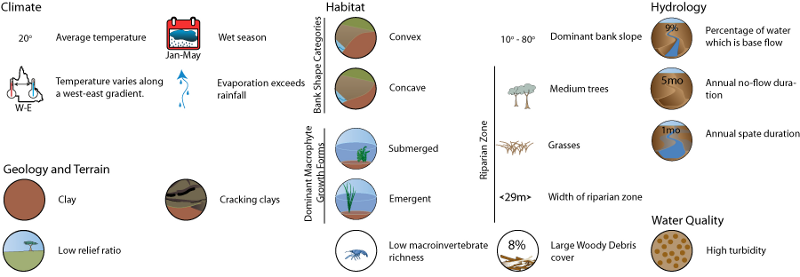 Click on elements of the model or select from the tabs below
GaugesModelled pre-development data from 40 gauges within the Murray-Darling FBP were used for these analyses. Key features of typical hydrographs over multiple temporal scales were used to characterise the following aspects.  State of the Rivers sites used in the calculation of the Murray-Darling FBP riparian vegetation features Base flow and flood flowOn average less than 10% of flow (by volume) is base flow and conversely over 90% of flow is related directly to flood flow from rainfall events. One gauge in the upper portion of the FBP (Condamine River at Elbow Valley) had 20% of flow (by volume) as base flow. Base flow (from groundwater sources) is a minor contributor to overall flow in this FBP. The heavy dependency of flow on run-off from rainfall contributes to the intermittent nature of flow in this FBP and the characteristic long spells without flow.
Information about base and flood flow
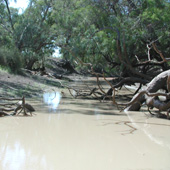
Magnitude of spatesMagnitude of spates averaged 0.06 to 0.1 Ml km2 day-1, but much larger and smaller average values occur within the FBP at particular sites. There is an average of 3.7 to 4.3 spates per year with 2.3 to 2.4 of these in the wet season and 1.3 to 1.7 in the dry season. The average duration of spates is about 9 to 11 days. The timing of spates is not limited to the wet season so biota that utilise spates for some part of their life history are able to be opportunistic in that they are not confined to do so during only part of the year. The magnitude of spates in the Murray-Darling FBP is low with respect to some other FBPs (e.g. Wet Tropics FBP). The low magnitude of spates coupled with low stream slopes implies that spates in this FBP generate a small level of disturbance and perturbation to aquatic ecosystems when compared to some of the other FBPs. In the Murray-Darling FBP spates also play the important role of inundating floodplains and filling temporary wetlands. Re-wetting of dried sediments can release significant amounts of nutrients and lead to high rates of primary and secondary production on a large spatial scale.
Information about magnitude of spates
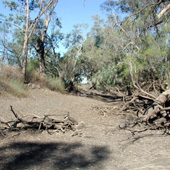
No flow spellsFlow is intermittent in the Murray-Darling FBP and thus no flow spells are an important feature of the hydrology. The mean continuous period of no flow for the FBP is 43 days but there is a strong gradient from the east (only 5 days in the upper Condamine) to west (280 days in the Paroo). The average longest dry spell in the reporting period is approximately one year with extremes of one month to 3.5 years, again from east to west. The average number of no flow spells for the entire record is 380, but again this ranges from only 11 spells in the east to 1538 in the west. The mean continuous period of flow between no flow spells is 143 days but this can be as long as 7 years in the east and as short as 4 days in the west. The average longest period of flow between no flow spells is approximately 4 years ranging from over 26 years in the east to only 92 days in the west. Due to the long periods without flow, local fauna must have the ability to survive long periods without flow. Persistent waterholes are the most evident form of refugium in the Murray-Darling FBP. For example, in the Moonie River, waterholes provide the primary source of habitat for aquatic biota during dry times. The fish, turtles, invertebrates and plants that reside in them are adapted to survive the variable and often hash conditions that these environments present. The persistence of these refugia through dry spells, along with the hydrological connectivity between them during flows are the primary factors maintaining populations of fish in the system. Another possible source of refuge in the FBP is migration into sub-service water in the form of shallow alluvial aquifers. Little is known of the use of these potential refuges by aquatic organisms in this FBP.
Information about no flow spells
Rise and fall of the hydrographThe mean rate of rise for the FBP is approximately double the mean rate of fall. Similarly, the mean greatest rate of rise for the FBP is approximately double the mean greatest rate of fall.
Information about the rise and fall of the hydrograph
Table: Rise and Fall of the Hydrograph per day relative to mean daily flow
Wet and dry seasonsThe proportion of annual flow is not evenly distributed between months. The months January to May have a greater proportion of annual flow and the months June to December a smaller proportion. Based on this the wet season for the Murray-Darling FBP is January to May and the dry season June to December.
Information about wet and dry seasons
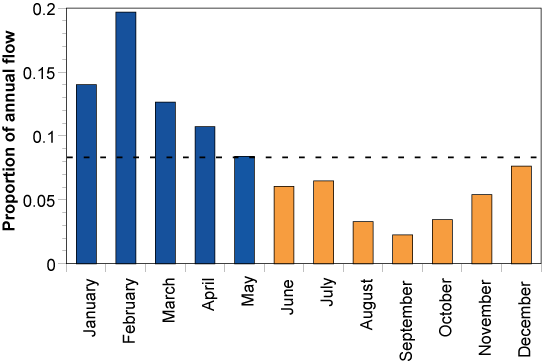 The dashed horizontal line represents the proportion of mean total annual flow in each month if it were equal for all months. The wet season is defined as months with a higher proportion than this (blue bars) and the dry season (orange bars) as months with a lower proportion.
Last updated: 22 March 2013 This page should be cited as: Department of Environment, Science and Innovation, Queensland (2013) Queensland Murray-Darling Freshwater Biogeographic Province – Hydrology, WetlandInfo website, accessed 8 May 2025. Available at: https://wetlandinfo.des.qld.gov.au/wetlands/ecology/aquatic-ecosystems-natural/riverine/freshwater-biogeo/murray-darling/hydrology.html |
|||||||||||||||||||||||||||||||||||||||||||||||||||||||||||||||||||||||||||||||||||||||||||||||||||||||||||||||||||
Site footer

 — Department of the Environment, Tourism, Science and Innovation