

|
|
Queensland Murray-Darling Freshwater Biogeographic ProvinceQueensland Murray-Darling Freshwater Biogeographic Province – Habitat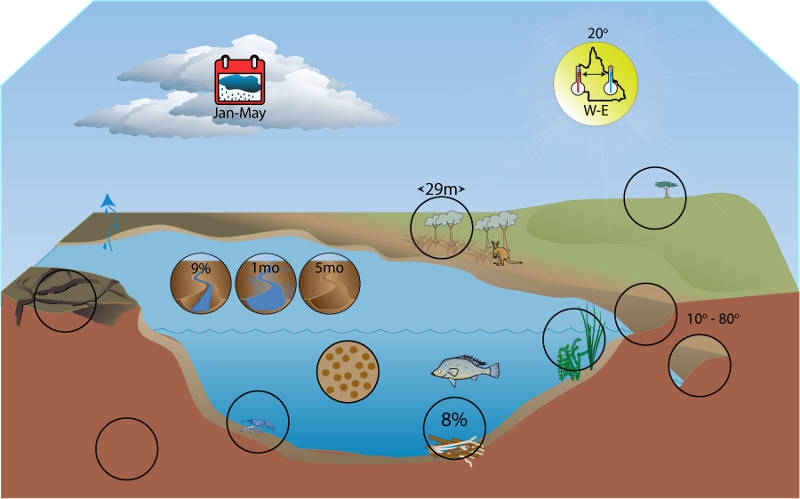 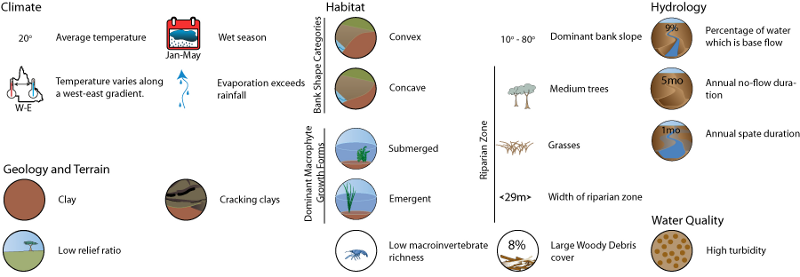 Click on elements of the model or select from the tabs below
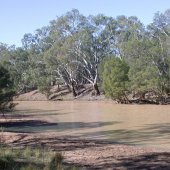
Bank shape and slope
State of the Rivers survey data from 217 reference sites show that all bank slope categories are present in the FBP and each category dominates at a minimum of 10% of sites. Moderate slope is the most common dominant category. All shape categories also occur, but undercut and wide lower bench shaped banks occur at less than 10% of sites and rarely dominate. Convex and concave are the most often present and most often dominant shaped banks in the FBP. Information about bank shape and slope
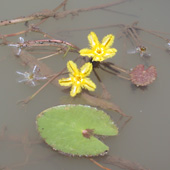
Riparian vegetation and macrophyte (aquatic plant)
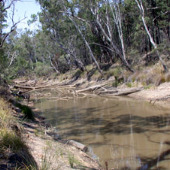
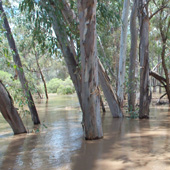
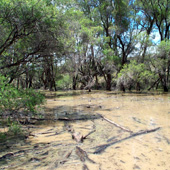
State of the Rivers survey data from 217 reference sites in the FBP show that the average width of riparian zones is approximately 30 m. Grasses, medium trees and small trees typically dominate riparian vegetation cover. Trees over 30 m tall, woody shrubs and ferns typically form very minor components of riparian cover and vines, tree ferns, mosses and palms are typically absent. Riparian zones are on average only 11 to 13% bare of vegetation. The riparian zone in the Murray-Darling FBP is generally broad with sparse vegetation cover. The understorey is dominated by grasses, which are a poor food source for macroinvertebrates. Riparian shading is generally not significant as channels are wide, and there is low vegetative cover. This results in higher water temperatures that would otherwise occur alongside heavily vegetated riparian zones.
Information about Riparian Vegetation and Macrophytes
Macrophyte (aquatic plant)State of the Rivers survey data from 217 reference sites in the FBP show that macrophytes were present at about 70% of sites in the Murray-Darling FBP. Mean total cover was 13 to 17% which was typically dominated by emergent growth forms. The prevalence of emergent growth forms is largely a result of the high turbidity of stream water throughout the system, which reduces light penetration and the prevalence of submerged forms. Emergent macrophytes provide habitat for ground-dwelling frogs, and may provide food for waterbirds [Link to macrophyte case study].
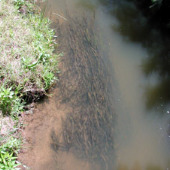
Substrate composition and heterogeneity
The number of substrate classes recorded in the FBP is low compared to most other FBPs. One to six classes were recorded from edge habitat with most samples having three to four classes. The median of two classes is lower than all but Lake Eyre and Bulloo and Wallum FBPs. Pool habitats ranged from one to six classes with most having two to four. The median of three classes is higher than Lake Eyre and Bulloo and Wallum FBPs and similar to several other FBPs, but there are fewer samples with more than four classes than the South East and Wet Tropics FBPs.
Substrate heterogeneity is more variable in edge and pool habitats in the Murray-Darling FBP than it is in most other FBPs and all habitats have lower median heterogeneity than most other FBPs in Queensland.
Information about Substrate Composition and Heterogeneity
Macroinvertebrate RichnessLow substrate heterogeneity and the predominance of fine substrates, with typically little hard substrate present, is likely to be a major contributor to the lower macroinvertebrate diversity in the Murray-Darling in comparison with other FBPs. There are significant correlations in this FBP between macroinvertebrate sample richness in pool habitat and both substrate heterogeneity and number of substrate classes present, but no significant correlations for edge or riffle habitat, although over the entire state these are also significantly correlated. The availability of coarser substrates in riffles is severely limited in this FBP by hydrology typified by intermittent flow with long dry spells. Despite this, when riffles are present they are likely to represent critical habitat for some species.
Table: Results of Pearson’s correlations between substrate heterogeneity and number of substrate classes present with macroinvertebrate sample richness from ABMAP reference sites in the Murray-Darling FBP. Significant p values (<0.05) are indicated in italics.
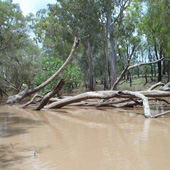
Information about macroinvertebrate richness Woody debris and snags
Large Woody Debris (LWD) and snags are conspicuous components of many rivers in the FBP. State of the Rivers survey data from 217 reference sites in the FBP show that on average there are 60 to 80 items of LWD and snags per kilometre reach of river and that these cover 7 to 9% of the river bed. This varies from site to site, at the extremes there can be no LWD present, or 100% coverage of the bed. Individual logs and branches are more common and form a greater coverage than do snags (log jams and branch piles). Patches of leaf litter and twigs cover on average 4 to 6% of the stream bed with 30 – 38 patches per kilometre of river. This can range however from no patches to nearly 300 with up to 60% bed cover. Due to the dominance of fine sediment substrates, in many situations within the Murray-Darling FBP woody debris is likely to be the primary source of hard substrate available to local fauna. It is therefore vital for any of the organisms requiring hard substrates for part of their life histories.
Information about Woody Debris and Snags
Last updated: 22 March 2013 This page should be cited as: Department of Environment, Science and Innovation, Queensland (2013) Queensland Murray-Darling Freshwater Biogeographic Province – Habitat, WetlandInfo website, accessed 8 May 2025. Available at: https://wetlandinfo.des.qld.gov.au/wetlands/ecology/aquatic-ecosystems-natural/riverine/freshwater-biogeo/murray-darling/habitat.html |
||||||||||||||||||||||||||||||||||||||||||||||||||||||||||||||||||||||||||||||||||||||||||||||||||||||||||||||||||||||||||||||||||||||||||||||||||||||||||||||||||||||||||||||||||||||||||||||||||||||||||||||||||||||||||||||||||||||||||||||||||||||||||||||||||||||||||||||||||||||||||||||||||||||||||||||||||||||||||||||||||||||||||||||||||||||||||||||||||||||||||||||||||||||||||||||||||||||||||||||||||||||||||||||||||||||||||||||||||||||||||||
Site footer

 — Department of the Environment, Tourism, Science and Innovation