|
|
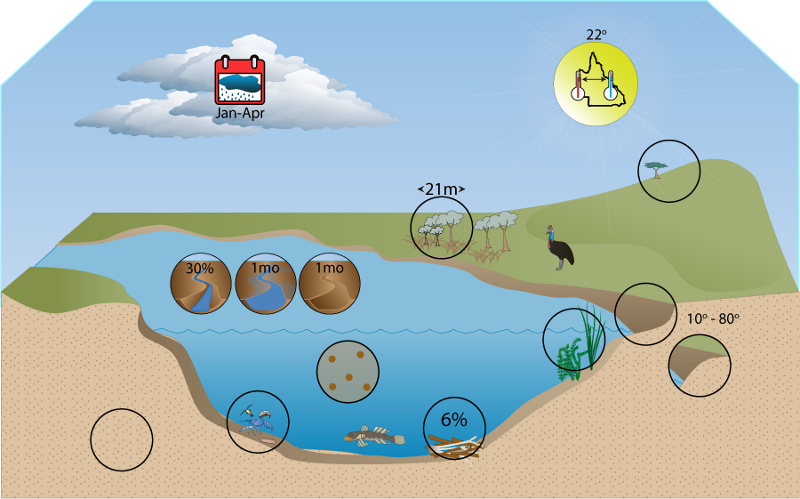
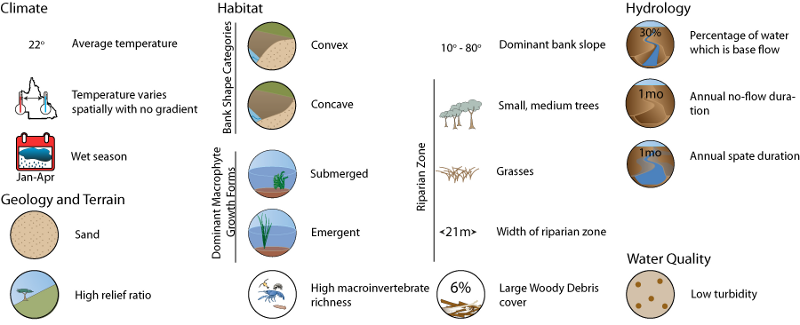
Wet Tropics Freshwater Biogeographic ProvinceWet Tropics Freshwater Biogeographic Province – Hydrology  Click on elements of the model or select from the tabs below Gauges
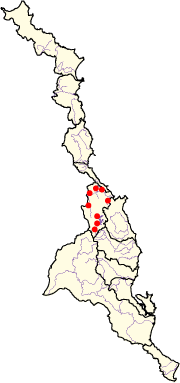
Modelled pre-development data from 8 gauges within the Wet Tropics FBP were used for these analyses. Key features of typical hydrographs over multiple temporal scales were used to characterise the following aspects.
Base flow and flood flowOn average approximately 30% of flow (by volume) is base flow and conversely 70% of flow is related directly to flood flow from rainfall events. Base flow from groundwater sources is a relatively important contributor to overall flow in the Wet Tropics FBP. This is likely to be a major contributor to the perennial flow identified in the FBP. This suggests that groundwater ecosystems may be significant within the FBP, but these are not known to have been investigated. Information about base and flood flow
Magnitude of spatesMagnitude of spates averaged 3 to 4 Ml km2 day-1, but larger and smaller average values occur within the FBP at particular sites. There is an average of approximately 3 spates per year with most of these in the wet season and only approximately one every two years in the dry season. The average duration of spates is about 11 to 13 days. The timing of spates is largely limited to the wet season so biota that utilise spates for some part of their life history are confined to do so during only part of the year. Conversely species that may have an aversion to spates for some part of their life history may be able to specialise in utilising the dry season. The magnitude of spates in the Wet Tropics FBP is very high with respect to some other FBPs (e.g. Murray-Darling FBP). This (in combination with high stream slopes) implies that spates in this FBP represent a high disturbance and perturbation to aquatic ecosystems. This would be a contributing factor to the high heterogeneity of substrate sizes typical of this FBP and can be considered a driver of biological diversity. During spates the high heterogeneity of substrate sizes typical of this FBP probably results in the availability of hydraulically dead patches that are not subject to the high velocities and sheer stresses experienced by most of the stream. Biota in such refuges would avoid physical disturbance. Information about magnitude of spates
No flow spellsFlow can generally be considered to be perennial in the Wet Tropics FBP. Of the 8 modelled flow sites available, 7 had continuous flow for the entire 73 year record. Consequently average values for no-flow spells are extremely low compared to the rest of the state. The one site where no-flow spells were recorded had on average 3.5 spells per year lasting on average 9 days each, still relatively low for the state. The longest recorded spell was over 5 months. Overall this site had no flow approximately 9% of the time. Periods of flow between no-flow spells typically lasted 96 days but the longest such period was approximately 5 years without flow stopping. Because flow is generally perennial, biota that are obligate flow specialists are present in the Wet Tropics FBP. These taxa are probably not able to persist through sustained periods of no flow. For example the Wet Tropics endemic scaleless goby (Shismatogobius sp.) is restricted to areas of rapid velocity flowing in an un-broken laminar fashion which occurs only at the head of riffles and rapids[1]. The Mulgrave River goby (Glossogobius sp.4) is another Wet Tropics endemic fish that also specialises on inhabiting riffles and rapids[1]. Another example is the morphologically unusual mayfly family prosopistomatidae which is restricted within Australia to the Wet Tropics FBP where its preferences are riffle and run habitats with flow velocities greater than 0.5 m sec-1 over cobble substrates[2]. It appears from distributional and habitat preference data that persistence of this family depends upon perennial flow or at least very short no flow spells. Information about no flow spells
Rise and fall of the hydrographThe mean rate of rise for the FBP is approximately double the mean rate of fall. Similarly, the mean greatest rate of rise for the FBP is approximately double the mean greatest rate of fall. Information about the rise and fall of the hydrograph Table: Rise and Fall of the Hydrograph per day relative to mean daily flow
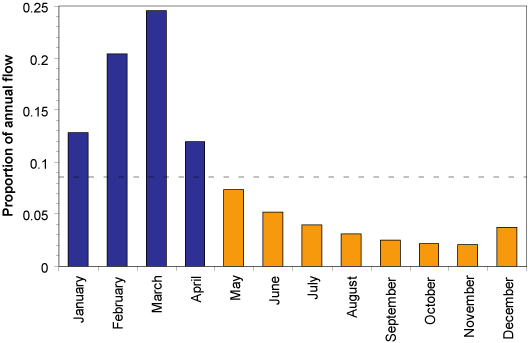
Wet and dry seasonsThe proportion of annual flow is not evenly distributed between months. The months January through to April have a greater proportion of annual flow than May to December. Based on this, the wet season for the Wet Tropics FBP is January through to April, and the dry season May to December. Compare this pattern with the other FBPs. Information about wet and dry seasons
 The dashed horizontal line represents the proportion of mean total annual flow in each month if it were equal for all months. The wet season is defined as months with a higher proportion than this (blue bars) and the dry season (orange bars) as months with a lower proportion. References
Last updated: 22 March 2013 This page should be cited as: Department of Environment, Science and Innovation, Queensland (2013) Wet Tropics Freshwater Biogeographic Province – Hydrology, WetlandInfo website, accessed 8 May 2025. Available at: https://wetlandinfo.des.qld.gov.au/wetlands/ecology/aquatic-ecosystems-natural/riverine/freshwater-biogeo/wet-tropics/hydrology.html |
|||||||||||||||||||||||||||||||||||||||||||||||||||||||||||||||||||||||||||||||||||||||||||||||||||||||||||||||||||||||||||

 — Department of the Environment, Tourism, Science and Innovation


