

|
|
Wet Tropics Freshwater Biogeographic ProvinceWet Tropics Freshwater Biogeographic Province – Climate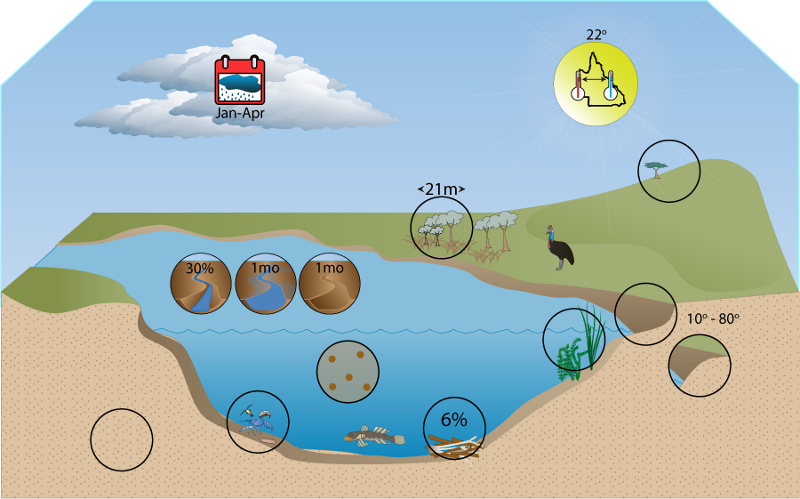 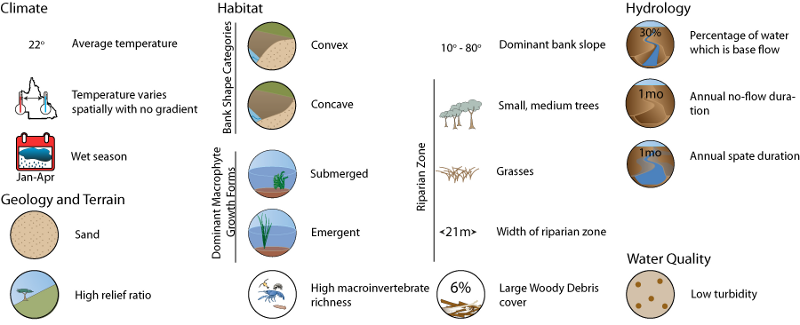 Click on elements of the model or select from the tabs below RainfallAnnual mean precipitation is high throughout the FBP, with a mean of 1800 mm and maximum of 7512mm. This is the highest precipitation value recorded in Queensland. The values for the driest quarter mean precipitation throughout the FBP are patchy, and range from low (with a minimum value of 0 mm recorded) in the western and northern extremities to high elsewhere. Rainfall erosivity is on average very high and ranges from moderate to very high throughout the FBP. Precipitation results in lateral run-off from the surrounding catchments into rivers, supplying water, sediment, nutrients and debris (allochthonous inputs) to the system. The high volumes and erosivity of rainfall in this FBP suggests a high potential rate and volume of input. The high volume of rain is responsible for the perennial or near-perennial nature of river flow in the FBP both via direct run-off and by recharging groundwater sources contributing base flow. The high altitude Bellenden Ker Range has endemic invertebrate species from families that are aquatic (various caddisflies), but because there is so much rainfall these species are able to live on land.
TemperatureThe annual mean temperature for the Wet Tropics FBP ranges from cold to moderate, with the lowest temperatures recorded from the areas of the FBP at higher altitude. Values for the highest weekly mean maximum temperature are similar throughout the FBP. Values for the lowest weekly mean minimum temperature range from moderate to high. The ratio of the hottest weekly maximum to the coldest weekly minimum values was low throughout the FBP. This suggests that seasonality in temperature is not pronounced e.g. the temperature difference between the hottest and coldest times of year is small.
Summary Maps of FBP Temperature Water Balance
Mean Annual Run-off in the FBP is high (7.24 mm). Information about water balance
Last updated: 22 March 2013 This page should be cited as: Department of Environment, Science and Innovation, Queensland (2013) Wet Tropics Freshwater Biogeographic Province – Climate, WetlandInfo website, accessed 8 May 2025. Available at: https://wetlandinfo.des.qld.gov.au/wetlands/ecology/aquatic-ecosystems-natural/riverine/freshwater-biogeo/wet-tropics/climate.html |
Site footer

 — Department of the Environment, Tourism, Science and Innovation