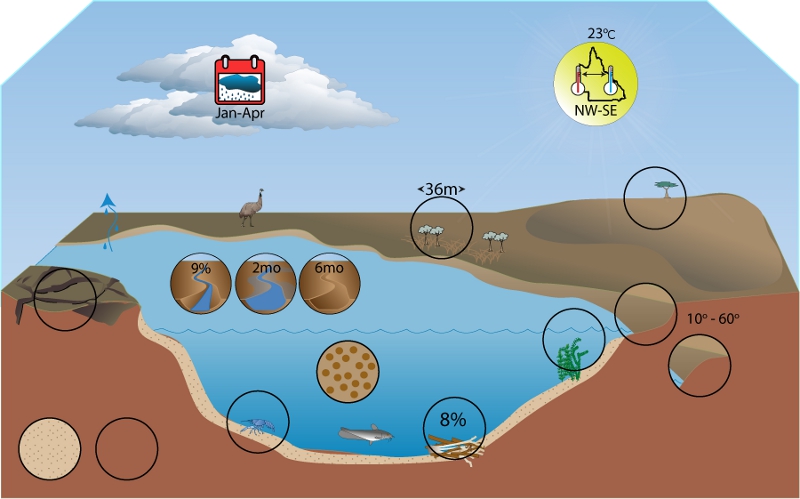
State of the Rivers survey data from 279 reference sites show that all bank slope categories are present in the FBP. Moderate and low slopes represent the predominant categories. They occur at over half the sites, and represent the dominant categories at over 30% of sites. All shape categories also occur, the concave and convex classes being the most often present. In contrast wide lower bench and undercut banks occur least frequently (<10% of sites).
Riparian vegetation and macrophyte (aquatic plant)
State of the Rivers survey data from 279 reference sites in the FBP show that the average width of riparian zones is approximately 36 m. Grasses, medium trees and small trees typically dominate riparian vegetation cover. Trees over 30 m tall, woody shrubs and ferns typically form very minor components of riparian cover and vines, tree ferns, mosses and palms are typically absent. On average 23% of Riparian zones are bare of vegetation.
State of the Rivers survey data from 279 reference sites in the FBP show that macrophytes were present at only 16% of sites in the Lake Eyre and Bulloo FBP. Mean total cover was 1%, with submerged macrophytes most frequently observed, present at 14% of sites.
Macrophyte cover
% sites present
Mean
SE
Max
Min
Submerged (%)
14
0.6
0.18
30
0
Floating (%)
1.5
0.3
0.17
40
0
Emergent (%)
5
0.1
0.05
10
0
Total (%)
16
1
0.29
60
0
Substrate composition and heterogeneity
The number of substrate classes recorded in the FBP are lower than the other FBPs in Queensland except Wallum. Only two classes were recorded from edge habitat, silt/clay dominated composing 75% of the substrate. Pool substrates were more diverse, containing all the classes, though these were still primarily sand and silt/clay.
Edge habitat is exclusively silt/clay and sand.
Pool bed material is similarly dominated by substrates with fine particles, although bedrock also occurs quite frequently.
No riffle habitat has been sampled in the LEB FBP, though it is present.
Substrate heterogeneity is least variable in edge habitats of the Lake Eyre Bulloo FBP when compared with other Queensland FBPs. Pool habitat was more variable ranging across six classes but with a mean of two. In both these cases this is the lowest average number of classes in all FBPs except Wallum.
The low substrate heterogeneity, and almost complete domination of fine substrates, is likely to be a significant contributor to the low macroinvertebrate diversity of the Lake Eyre and Bulloo FBP. However, because there were no significant correlations, between macroinvertebrate richness and either substrate variable, in this FBP it is likely that other environmental processes have a greater effect on the biota (e.g. the extreme flow regimes of the region).
Table: Results of Pearson’s correlations between substrate heterogeneity and number of substrate classes present with macroinvertebrate sample richness from ABMAP reference sites in the Lake Eyre and Bulloo FBP. Significant p values (<0.05) are indicated in italics.
State of the Rivers survey data from 279 reference sites in the FBP show that on average there are approximately 30 items of LWD and snags per kilometre of river, which cover about 7 to 9 % of the river bed. Smaller woody debris (branches and leaves/twigs) occur more frequently than logs; however they cover a roughly similar proportion of the streams.
Patches of leaf litter and twigs are very sparse, and cover on average 2% of the stream bed with 9-12 patches per kilometre of river. This can range however from no patches to 225 with up to 70% bed cover.
Department of Environment, Science and Innovation, Queensland (2013) Queensland Lake Eyre and Bulloo Freshwater Biogeographic Province – Habitat, WetlandInfo website, accessed 8 May 2025. Available at: https://wetlandinfo.des.qld.gov.au/wetlands/ecology/aquatic-ecosystems-natural/riverine/freshwater-biogeo/lake-eyre-and-bulloo/habitat.html


 — Department of the Environment, Tourism, Science and Innovation