

|
|
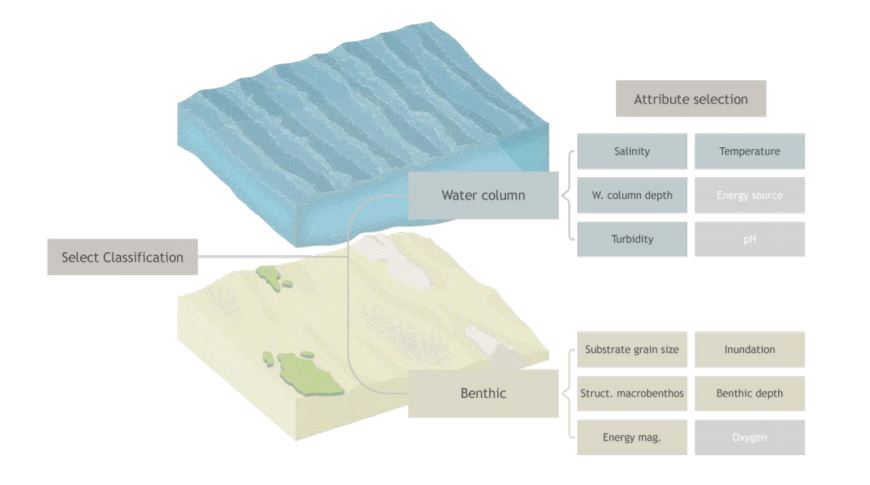
Intertidal and subtidal attributesAttributes for the purpose of classification (e.g. Intertidal and Subtidal Classification scheme) cover a range of themes including terrain, substrate, energy, hydrology (physical/chemical) and biota.
Quick facts
Quick Links
Intertidal and Subtidal Biophysical AttributesEcosystems can be classified, described and defined by using measurable characteristics known as biophysical 'attributes' (biological, physical and chemical). These biophysical attributes, together with their ecosystem processes, determine how the ecosystems function and can be combined to form an ecosystem 'type'. To classify or determine intertidal and subtidal ecosystem types requires an understanding of which attributes will shape, influence and maintain the ecosystem. The purpose of the classification (or mapping), will determine which of these attributes are used. Key features of the attributes in the Intertidal and Subtidal Classification Scheme (scheme) include:
QualifiersQualifiers are descriptors of variability applied to an attribute: Naturalness, Trend, Period, Cover, Biotic height and Biomass. Qualifiers provide additional information for existing attributes and are similar to modifiers in other classification schemes[4]. Changes in ecosystems can be due to natural variation or from other sources, and can result in a shift of state or type of an ecosystem[7]. The nature of these changes and their influence on an attribute should be captured in classifying and mapping wherever possible. It is important to consider how natural variability influences structure (components) and functionality of ecosystems. The ‘Naturalness’ attribute qualifier describes the extent of human-induced change. For example, if the attribute Sediment grain size is classified as 'Sand' and this was the result of deposition from dredging activity, a category of 'Modified natural’ or ‘Artificial' could be assigned to the Naturalness attribute modifier. In this way, the inherent category of the attribute does not change from 'Sand' but the additional information may be used to interpret values or to classify components differently. Table 1 - Codes for the Naturalness qualifier
Table 2 - Attributes used in the scheme and relevance to each level showing whether they are benthic (B), water column (WC) or related to both (B/WC), and the levels to which they should apply.
Benthic ClassificationTheme: TerrainTerrain is defined here as the topography or shape of the sea floor (modified after LeCours[10]). It involves the vertical and horizontal dimensions of the sea floor surface. Terrain attributes are primarily derived from digital elevation models (DEM) of the sea floor and relate to its structure. Terrain (and benthic depth) is a product of geomorphic processes forming sea floor geomorphic features, such as those involved in continental drift, e.g. rifting, sea floor spreading, subduction, sea level rise and fall, erosion, deposition etc. The Queensland Intertidal and Subtidal Classification Scheme does not map evolutionary processes, only their end products e.g. the terrain. Benthic depth (and terrain) also influences hydrology themes, by forming boundaries between different water masses with different conditions, circulation patterns and species pools, and is correlated to hydrological and chemical attributes such as salinity, temperature, oxygen, water clarity and exported carbon[12]. Various terrain metrics exist, but only some of these directly influence ecosystem distribution, including benthic depth, shape or morphology, slope, patterns formed by morphology, the relative relief of these patterns and roughness. Originally developed for catchment hydrology and soil prediction, terrain attributes are now routinely used to map and model sea floor ecosystems[8]. Attributes under the terrain theme include: Theme: SubstrateAttributes relating to the composition of the substrate include the source type of rock (Sediment composition), whether it is consolidated or not (Consolidation), grain size of unconsolidated substrates (Sediment grain size), and the non-living composition of the substrate. Other substrate attributes involve complex processes, which are best explored in conceptual models, for example genesis of the substrate.
The following characteristics describe a change or variability in the substrate and apply to several substrate attributes (e.g. Lithology, Consolidation, Sediment grain size). Note that sediments usually occur in mixtures of different grain sizes termed 'sediment texture'. These qualifiers include:
Attributes under the substrate theme include:
Theme: Hydrology - PhysicalEnergy of the sea interacts with sea floor terrain which may be modified by the energy[17]. Energy source, magnitude and exposure influence sediment transport, erosion and accretion, resulting in changes to the terrain itself. There is a feedback loop between energy and morphology[9][3]. For example, the width of the continental shelf and its steepness, together with the degree of enclosure of a reef, influences the magnitude of energy exposure on coral reefs. This can be seen where tidal currents are forced through gaps in the ribbon reefs, and nutrients are transported in upwellings to Halimeda sp. macroalgal beds[17]. Energy also influences physical and chemical properties of water types and water masses, including the extent of tidal inundation, degree of mixing between different water masses and layers, suspension of particles, light penetration, temperature and salinity, nutrients and primary production. Ultimately these water column factors affect the benthos[16]. A map of dynamic attributes is a model, for example hydrodynamic models animate water movement in response to energy. Models are validated by field inventory, such as IMOS stations. Hydrodynamic models may provide metrics of the energy attributes of water, for example the GBR Hydrodynamic Model. When capturing metrics of non-enduring attributes, consideration of timing, persistence, duration, periodicity and variability is required over relevant intervals such as tidal, diurnal, weekly, tidal fortnight, tidal month, seasonal, annual, interannual (e.g. SOI), decadal (e.g. Pacific Decadal Oscillation), centuries, episodic or other specific periods (e.g. 40-60 day weather bands such as the Madden-Julian Oscillation). Several regime metrics may exist for the same attribute. For example water regime applies to freshwater and tidal inundation[2]. Attributes under the 'hydrology' theme include: Theme: BiotaBiotic attributes become more applicable at seascape, habitat and community scales. Some biotic attributes are also important at higher scales (e.g. the biotic attribute of ‘Coral’ shapes reef complexes at the subregional level, and the GBR and its lagoon at a regional level). Biotic attributes are focused on species that provide structural and mappable features[1][11]. While surface biota is mappable, infaunal (organisms living largely within the substrate) presence is usually only confirmed during inventory, however future inventory methods may enhance their detection. Although five to ten years is a nominated interval for identifying persistent biotic habitats, many biotic habitats also experience natural temporal variability. This requires a consideration of timing, persistence, duration, periodicity and variability over relevant intervals, such as tidal, diurnal, weekly, tidal fortnight, tidal month, seasonal, annual, interannual (e.g. Southern Oscillation Index), decadal (e.g. Pacific Decadal Oscillation), centuries, episodic and other specific periods such as 40-60 day weather bands (e.g. Madden-Julian Oscillation). ‘Stability of benthic substrates’, ‘ecological succession’, ‘disturbance’, ‘resilience’, ‘alternative stable states’ and ‘phase-shifts’ (e.g. change from coral to algae[5][6]) are all concepts related to ‘drivers’ and do not form part of this classification. Repeated application of typology and mapping may detect key changes in ecosystems required to inform monitoring programs. It is often easier to measure abiotic surrogates (e.g. terrain, substrate, physical/chemical hydrology) to model the distribution of biotic ecosystems, than to map the biotic ecosystems themselves. Frequently, biota may not consistently respond to the same attributes, responding to other patterns and life processes not captured by these attributes[13][15]. Critical biotic attributes of species richness and abundance can often be modelled, but are difficult to reliably scale-up to habitat maps. The limitation of available biota inventory data is that it is often focussed on an ecosystem of interest (e.g. seagrass, mangroves, coral etc.) and may apply different survey standards, analysis method, output and spatial attribute, at varying spatial scales. See more on the Structural macrobiota composition attribute under the Biota theme. Pages under this sectionReferences
Last updated: 27 October 2021 This page should be cited as: Department of Environment, Science and Innovation, Queensland (2021) Intertidal and subtidal attributes, WetlandInfo website, accessed 8 May 2025. Available at: https://wetlandinfo.des.qld.gov.au/wetlands/ecology/aquatic-ecosystems-natural/estuarine-marine/itst/ |

Site footer

 — Department of the Environment, Tourism, Science and Innovation