

|
|
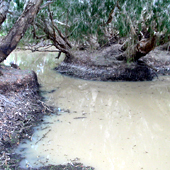
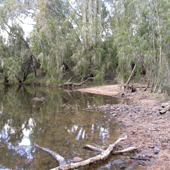
Central Freshwater Biogeographic ProvinceCentral Freshwater Biogeographic Province – Habitat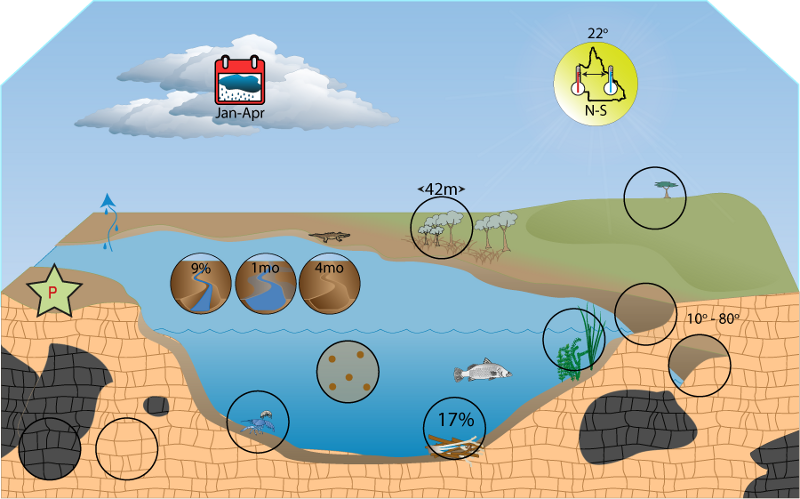 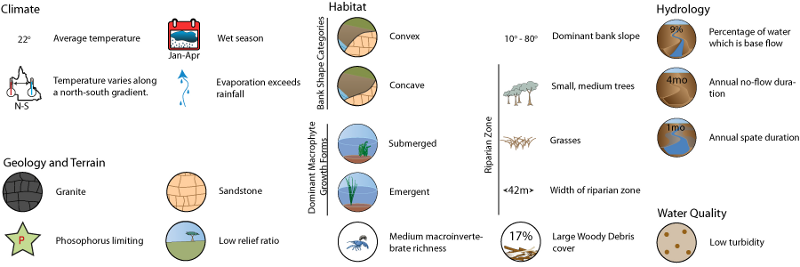 Click on elements of the model or select from the tabs below Bank shape and slopeState of the Rivers survey data from 190 reference sites show that all bank slope categories are present in the Central FBP and all classes are dominant at a minimum of 7% of sites. Moderate slope is the category dominant at the highest proportion of sites, with steep and low slope also often dominating. All shape categories also occur, but wide lower bench and undercut shaped banks occur at less than 10% of sites and are rarely dominant. Convex and concave are the most often present and most often dominant bank shapes in the FBP. Banks with low slopes and with steps or flat benches are likely to accumulate organic matter to a greater degree than steep banks and when inundated such accumulations can provide habitat for biota and sources of energy to aquatic foodwebs. Bank slope also influences the benthic photic zone area in turbid systems. As light penetration is a function of water depth, shallow sloping areas, benches or steps are likely to provide a greater area of benthic production when innundated than steep sloping banks. Inundated benches and undercut areas represent important habitat for biota. For example, larval and juvenile golden perch (Macquaria ambigua) utilise inundated vegetated benches and there is evidence recruitment is more successful in the presence of these features. Other species of fish (such as the eel-tailed catfish Tandanus tandanus) utilise undercut banks as an important adult habitat. Information about bank shape and slope
Riparian vegetation and macrophyte (aquatic plant)State of the Rivers survey data from 191 reference sites in the FBP show that the average width of riparian zones is approximately 40 m. Grasses, medium trees and small trees typically dominate riparian vegetation cover. Woody shrubs and herbs/forbs are present and trees over 30 m tall, vines, rushes/sedges, ferns and palms typically form very minor components of riparian cover. Tree ferns and mosses are typically absent. All vegetation classes are present in the FBP, though the dominant class varies between individual sites. Conversely, all classes are absent from some individual sites. Riparian zones are on average only 11 - 13% bare of vegetation. Information about Riparian Vegetation and Macrophytes
MacrophytesState of the Rivers survey data from 190 reference sites in the FBP show that macrophytes were present at 29% in the Central FBP. Mean total cover was 6%, with emergent and submerged macrophytes most frequently observed, present at 29 and 38% of sites respectively.
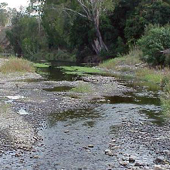
Substrate composition and heterogeneityThe number of substrate classes recorded from sites in the Central FBP is high with respect to most other FBPs in Queensland. An average of almost three classes were recorded from edge habitat with a range of one to six classes. Pool habitats averaged 3.5 classes and ranged from one to six, while riffle habitat averaged almost four classes and ranged from one to seven.
Substrate heterogeneity is consistent between habitat types in the Central FBP and is high compared to other FBPs in Queensland. Information about Substrate Composition and Heterogeneity
Macroinvertebrate RichnessTable: Results of Pearson’s correlations between substrate heterogeneity and number of substrate classes present with macroinvertebrate sample richness from ABMAP reference sites in the Central FBP. Significant p values (<0.05) are indicated in italics
Information about macroinvertebrate richness Woody debris and snags
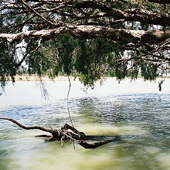
Large Woody Debris (LWD) and snags are conspicuous components of many rivers in the FBP, with both average density and cover approximately twice that recorded in the Wet Tropics and Murray-Darling FBPs. State of the Rivers survey data from 191 reference sites in the Central FBP show that on average there are approximately 180 items of LWD and snags per kilometre reach of river and that these cover about 18% of the river bed. This varies from a complete absence of LWD to up to 1800 items per kilometre and 100% bed coverage. Individual logs and branches are more common than snags (log jams and branch piles). Patches of leaf litter and twigs cover on average approximately 18% of the stream bed with 80–140 patches per kilometre of river. This can range from no patches to 6000 with up to 95% bed cover. Information about Woody Debris and Snags
Last updated: 22 March 2013 This page should be cited as: Department of the Environment, Tourism, Science and Innovation, Queensland (2013) Central Freshwater Biogeographic Province – Habitat, WetlandInfo website, accessed 15 December 2025. Available at: https://wetlandinfo.detsi.qld.gov.au/wetlands/ecology/aquatic-ecosystems-natural/riverine/freshwater-biogeo/central/habitat.html |
||||||||||||||||||||||||||||||||||||||||||||||||||||||||||||||||||||||||||||||||||||||||||||||||||||||||||||||||||||||||||||||||||||||||||||||||||||||||||||||||||||||||||||||||||||||||||||||||||||||||||||||||||||||||||||||||||||||||||||||||||||||||||||||||||||||||||||||||||||||||||||||||||||||||||||||||||||||||||||||||||||||||||||||||||||||||||||||||||||||||||||||||||||||||||||||||||||||||||||||||||||||||||||||||||||||||||||||||||||||||||||
Site footer

 — Department of the Environment, Tourism, Science and Innovation