

|
|
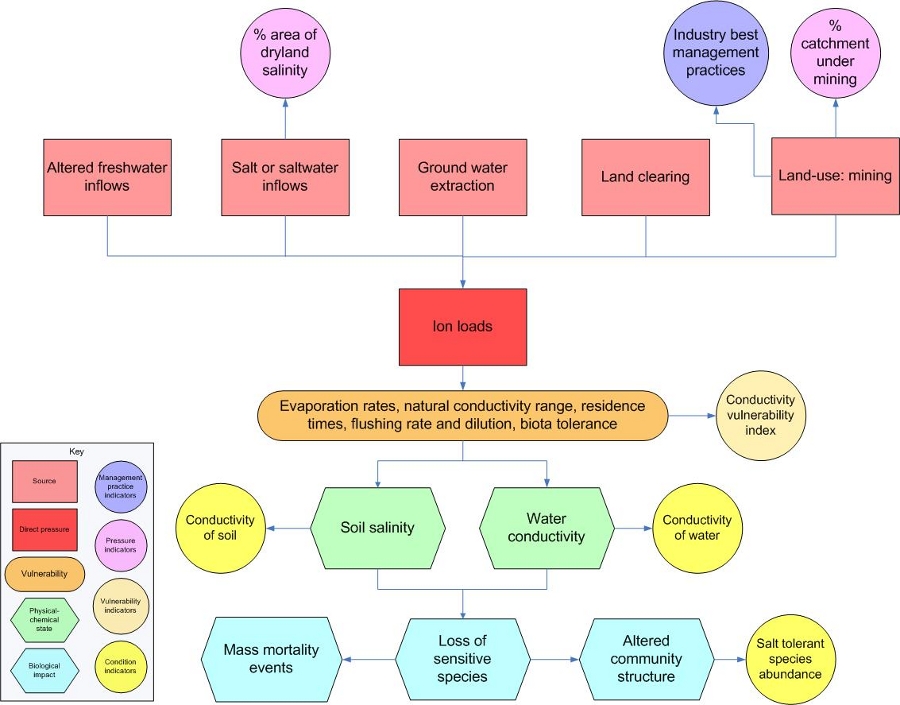
Salinity – VulnerabilitySalinity – VulnerabilityFlow chart showing the major elements associated with conductivity management
Click on elements of the flow chart or select from the tabs below
Last updated: 22 March 2013 This page should be cited as: Department of Environment, Science and Innovation, Queensland (2013) Salinity – Vulnerability, WetlandInfo website, accessed 8 May 2025. Available at: https://wetlandinfo.des.qld.gov.au/wetlands/management/pressures/lacustrine-palustrine-threats/conductivity/vulnerability.html |
Site navigation
Site footer
© The State of Queensland (Department of the Environment, Tourism, Science and Innovation) 2025

 — Department of the Environment, Tourism, Science and Innovation
You are here:
- Home
- Management
- Pressures
- Lacustrine and palustrine
- Salinity
- Vulnerability
Management
Aquatic ecosystem rehabilitation
Management of shorebirds and other waterbirds