

|
|
Commercial servicesCommercial services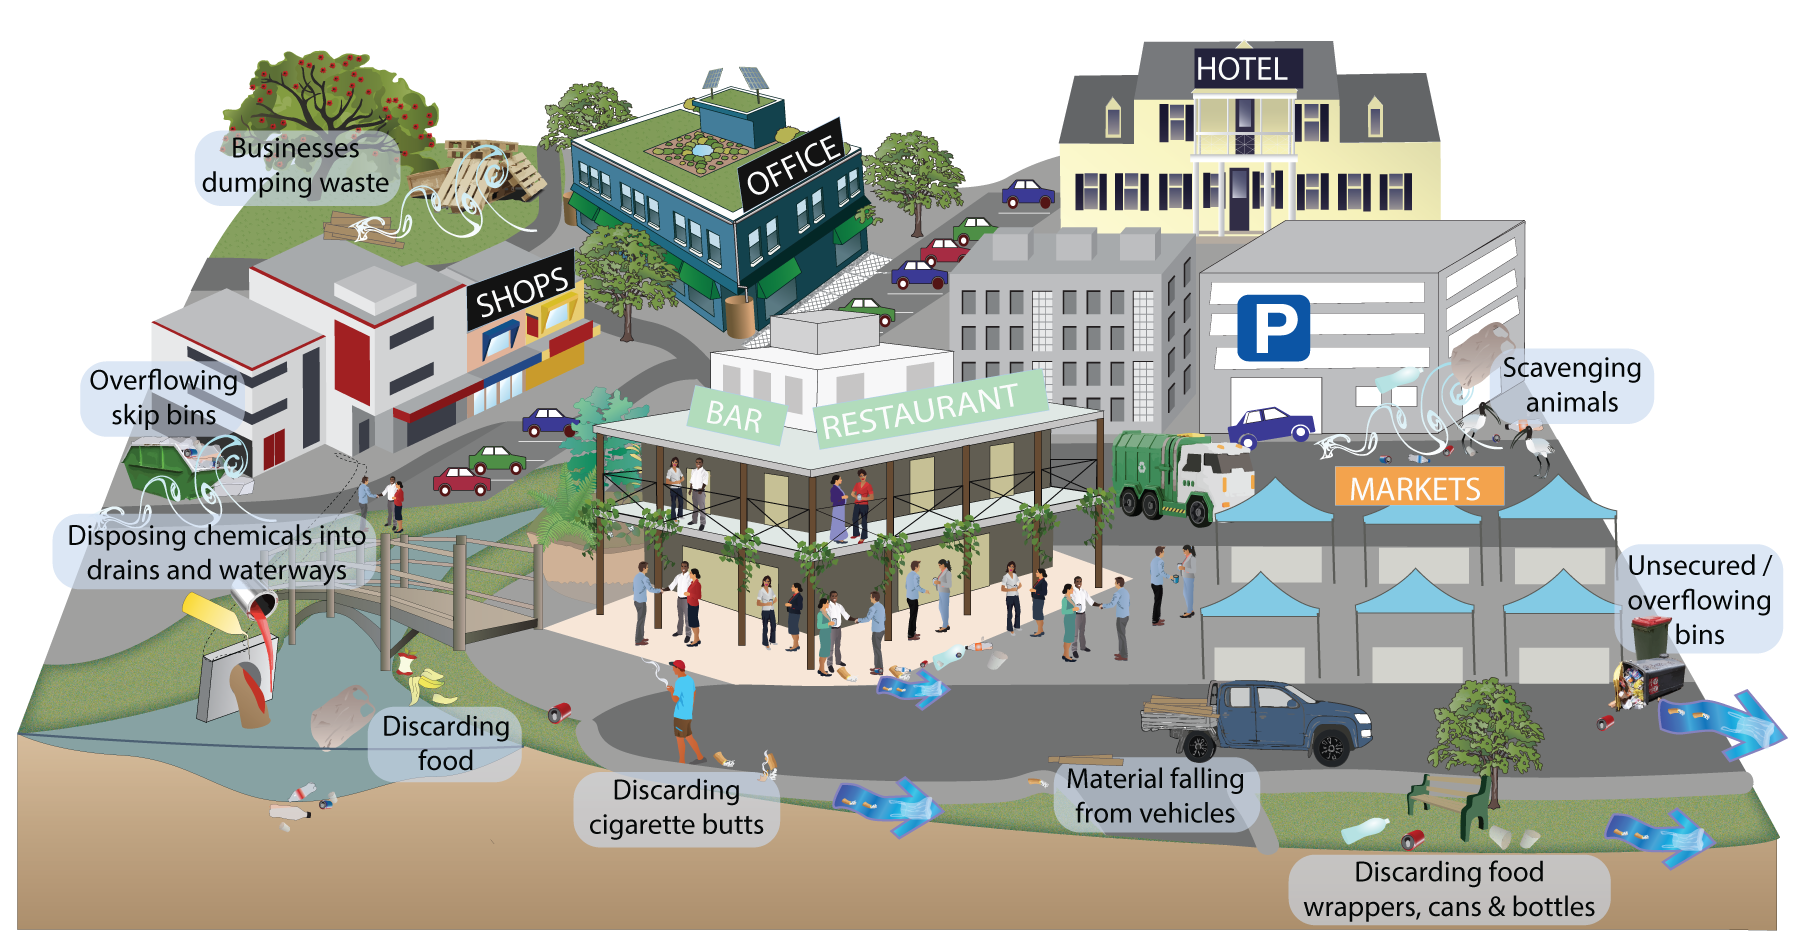
Click on elements of the model or select from the tabs below High rates of littering typically occurs in areas where commercial services are undertaken. Population density is a significant factor affecting the amount of waste pollution[1]. Waste in the commercial services sector can end up in the environment from:
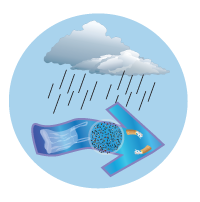
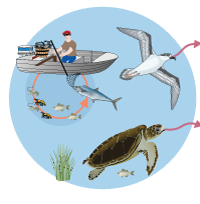
Based on the average count of litter items per 1,000m2, the National Litter Index (2018-2019) showed that shopping centres (95 items) and retail strips (77 items) had the highest number of litter items for Queensland. The litter count for shopping centres in Queensland was also 34 per cent higher than that for Australia, highlighting that litter in shopping areas is a key issue in Queensland[2]. Commercial services are typically areas where high littering occurs. Population density is a significant factor affecting the amount of waste pollution[1]. A Queensland Government project investigated the movement of litter in the environment across 9 land use types. A total of 79 litter devices were installed and monitored across locations including Emerald, Blackwater, Capella, Biloela, Yeppoon, Livingstone and Gladstone in the north, and several locations around Noosa in the south. From August 2021 to April 2022, the devices collected over 39,000 pieces of litter, removing 721kg of pollutants before they could enter waterways. The litter included over 16,000 cigarette butts, which remain the number one littered item in Queensland. An analysis of litter items in stormwater highlighted that the top three types of litter were cigarettes (48.8%), food related products (15.9%) and retail items (13.3%)[3]. Commercial services waste may move through the environment via four pathways:
References
Last updated: 14 April 2025 This page should be cited as: Department of Environment, Science and Innovation, Queensland (2025) Commercial services, WetlandInfo website, accessed 8 May 2025. Available at: https://wetlandinfo.des.qld.gov.au/wetlands/management/pressures/litter-illegal-dumping/sources/commercial/ |


Site footer

 — Department of the Environment, Tourism, Science and Innovation