|
|
Queensland wetland mapping FAQsThe Frequently Asked Questions provide information about the Queensland wetland mapping conducted by the Queensland Wetlands Program and address the relationship between this type of mapping and other wetland mapping in Queensland. Search FAQFor further information or assistance email questions to: wetlands♲des.qld.gov.au Wetland on-line education modules A series of on-line education modules, including Mapping wetlands in Queensland, have been prepared as a resource for people who want to learn more about wetlands. Users can download and use the contents of this education module to meet their learning and training needs. This information should be used in conjunction with information found on this website. This resource outlines the key principles of wetland mapping and should not be used for statutory purposes. How are wetlands defined?Due to the way legislation and policy has developed over time, Queensland has several different wetland definitions. This in turn has led to the development and use of different mapping products. The Queensland Wetlands Program wetland definition is based on the internationally accepted Ramsar definition. For more information on wetland definitions go to wetland definition page. What is the difference between an image, a map and mapping data?Though the terms are sometimes used interchangeably, an image, a map and mapping data are not the same thing. In a geographical information context:
What kinds of wetland mapping exist for Queensland and how do they relate to each other?Many different kinds of wetland mapping exist for Queensland. The following table provides information about some of the main wetland mapping products available at a state scale. Note that in addition to those listed there may be other wetland mapping products available for your local area.
Disclaimer: While every care is taken to ensure the accuracy of this product, the Queensland Government and Australian Government make no representations or warranties about its accuracy, reliability, completeness or suitability for any particular purpose and disclaim all responsibility and all liability (including without limitation, liability in negligence) for all expenses, losses, damages (including indirect or consequential damage) and costs which might be incurred as a consequence of reliance on the product, or as a result of the product being inaccurate or incomplete in any way and for any reason. Relative importance/contribution of source datasets to mapping
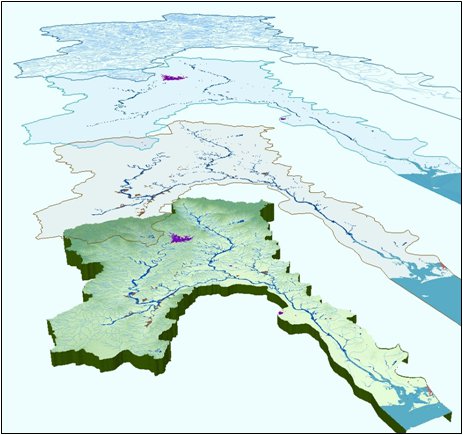
The wetland mapping combines several information sources to make one map:
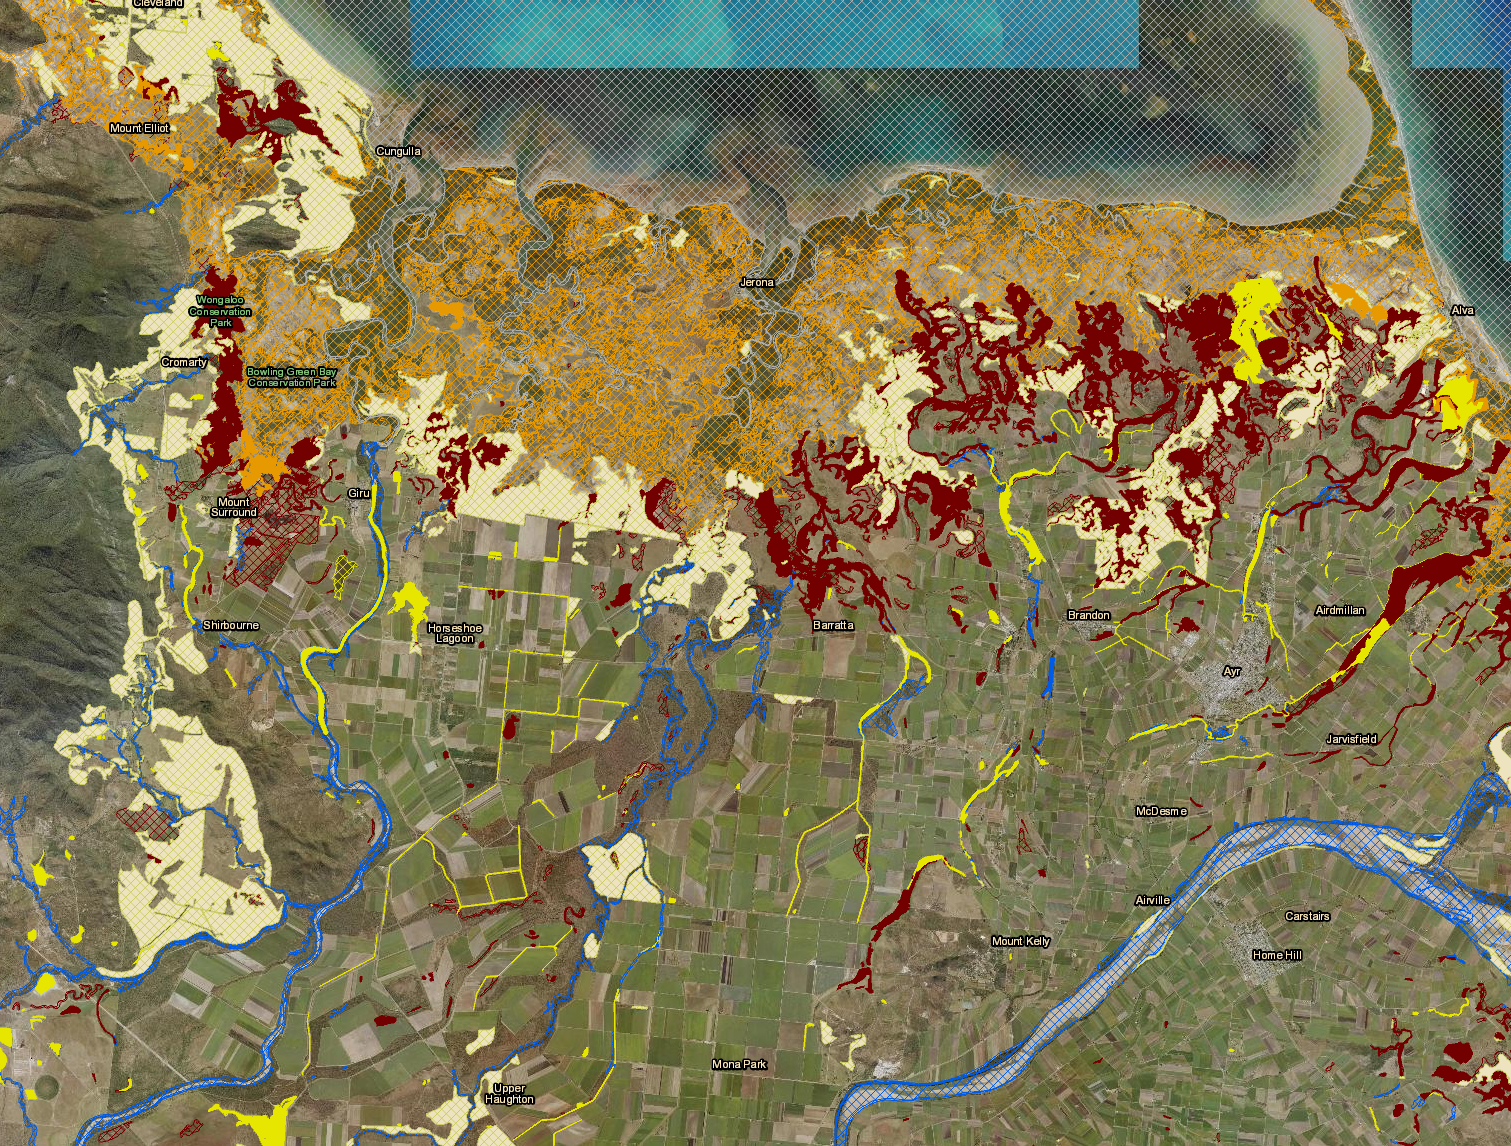
Wetland water-body mapping is better at identifying open water bodies with no vegetation and hydrologically modified wetlands. Regional ecosystem mapping is better for identifying vegetated and natural wetlands. Many wetlands were detected in both datasets however the overall extent of wetlands in Queensland required the use of both. What statutory maps are required for wetlands?Wetland naming protocol The Queensland Government encourages the community to suggest new names for geographic features in Queensland that have yet to be officially named. The place naming process includes consideration of naming issues, provision of recommendations to the relevant Minister under the Place Names Act 1994, publication of notices and maintenance of the gazetteer or register of place names. General Queensland wetland mapping FAQsWhy was the Queensland wetland mapping produced?A sound understanding of different wetland types—their characteristics and where these are located—is fundamental to managing and making decisions about wetlands. Producing comprehensive wetland maps for the whole of Queensland was therefore a key part of the Queensland Wetlands Program. The Queensland wetland mapping is base mapping. It has no legislative standing in and of itself, however it may be used as an input for other wetland mapping products which may have legislative standing. For more information please see the wetland mapping background page. How was the Queensland wetland mapping produced?The Queensland wetland mapping was produced using existing information including wetland water body mapping derived from satellite imagery, regional ecosystem mapping, springs, topographic, and hydrographic features datasets. The result is a consistent wetland map for the whole of Queensland. Ancillary data, such as satellite imagery analyses, geology and soil mapping was also used in attributing Queensland Wetlands Program wetland mapping products. For further information on ancillary data used, refer to the data dictionary. The wetland mapping was undertaken in accordance with a detailed peer reviewed methodology which included quality assurance measures for all steps in the process. For more detailed information on how the Queensland Wetlands Program wetland mapping was produced, please see the Queensland Wetland Mapping Method - A Method to Provide Baseline Mapping of Wetland Extent and Changes in Wetland Extent in Queensland. What information does the Queensland wetland mapping contain?The Queensland wetland mapping contains several datasets. They are:
A wide range of information is available in these datasets including information on ecology, geology, hydrology, soils, etc. For further information on the full list of attributes available in the data, refer to the Queensland Wetland Classification Database (QWCD). For more information on hydrological modifications in wetlands, refer to Wetland hydrological modification conceptual models. For further information on how the following attributes are derived please see the Queensland Wetland Mapping Method - A Method to Provide Baseline Mapping of Wetland Extent and Changes in Wetland Extent in Queensland. The interactive map server WetlandMaps and the Queensland wetland mapping data shows wetland distribution and classification and contains information about a subset of available wetland attributes, which can be queried and displayed to suit the user. What are the limitations and potential errors in the Queensland wetland mapping?Limitations in the use of Queensland Wetland Data to monitor changes in wetland extent can originate throughout the product development cycle from the source data to the production process. See Queensland Wetland Mapping Method - A Method to Provide Baseline Mapping of Wetland Extent and Changes in Wetland Extent in Queensland for more information. Does the Queensland wetland mapping contain information about wetland condition?The Queensland wetland mapping contains qualifiers on the naturalness of wetlands based on a set of defined activities that alter wetland hydrology. They do not define what hydrological change has occurred. These activities can apply at any scale and to any wetland system. They may cause a change in wetland system or the loss of the wetland. For example, partial draining of a lacustrine wetland may cause the wetland system to change to palustrine wetland, while complete draining would cause the loss of the wetland. For further information on these activities, refer to the wetland hydrological modification conceptual models. Other wetland condition attributes are not included in the mapping. For example, though the Queensland wetland mapping may indicate that a wetland is a particular regional ecosystem which contains species specific to that ecosystem, there may in fact not be many of those species in the wetland due to clearing and/or other disturbances. For further information on wetland assessment methods see the Asessment Toolbox and the Wetland Condition Assessment Tool (WetCAT). How can I get the Queensland wetland mapping?Queensland wetland program mapping delivery What is the currency, scale and accuracy of the Queensland wetland mapping data?Where can I find the metadata for the Queensland wetland mapping data?Who do I contact for more information, assistance or to provide feedback using the Queensland wetland mapping?Contact wetlands♲des.qld.gov.au What do I do if I think a change should be made to the mapping?Firstly you will need to check the Queensland Wetland Delineation and Mapping Guideline and the Queensland Wetland Definition Guideline which details the information that the Queensland Herbarium would require to review the mapping in an area. After you have collected the relevant information you can email the information to Queensland.Herbarium♲qld.gov.au with attention ‘Wetlands Mapping’ in the subject line. If the change is part of a development application it should go through the normal application process with the approving agency, who will refer you as the applicant to the delineation guideline. Once the assessing officer has received the information they will usually forward any relevant information on to the Queensland Herbarium. Changes to wetland mapping are publically released as part of periodic map updates, which document ongoing changes to wetland extent, incorporate new data and correct errors identified in the map. The release of updated mapping occurs at approximately two year intervals (from 2022). Historically the release of updated mapping occurred on a four year interval. Specific Queensland wetland mapping FAQsAre floodplains included in the Queensland wetland mapping?Many areas of floodplains do not remain wet long enough to generate wetland soils or support wetland species and therefore are not wetlands according to the Queensland Wetlands Program wetland definition. Parts of a floodplain may meet the definition of a wetland and these wetlands are assigned a wetland system (e.g. P, L, R, etc). They are sometimes called floodplain wetlands. Floodplains themselves, however, are not wetlands per se. Floodplain wetlands are included in the Queensland wetland mapping, however, floodplains are not. The Interactive FloodCheck map interface shows floodline overlays, historical and detailed data relating to Queensland floods. Are artificial wetlands included in the Queensland wetland mapping?Yes. Artificial and modified natural wetlands such as farm dams, ring tanks and canals are included in the Queensland wetland mapping. Not all wetlands are totally natural or totally artificial, some are natural wetlands that have been modified. One of the attributes included in the Queensland wetland mapping is a qualifier of wetland naturalness which identifies whether a wetland is natural, modified, or artificial. For more information on hydrological modifications in wetlands, refer to Wetland hydrological modification conceptual models. For more information on these hydrological modifiers go to What information does the Queensland wetland mapping contain? What does natural, slightly, moderately and highly modified and artifical wetlands mean?To see definitions for these terms see the Queensland Wetland Mapping Method - A Method to Provide Baseline Mapping of Wetland Extent and Changes in Wetland Extent in Queensland. Is riparian vegetation included in the riverine wetlands that are mapped?Riverine systems are often associated with fringing wetland vegetation which by definition is classified as a palustrine wetland system separate to the channel which is classified as a riverine wetland system. However, in many instances the Queensland wetland mapping scale is not fine enough to distinguish between the two wetland systems as the minimum width shown on the mapping is 35m on the coast and 75m for inland areas. Therefore areas mapped as a riverine wetland on the Queensland wetland mapping often include fringing palustrine wetlands. For more information see the Queensland Wetland Mapping Method - A Method to Provide Baseline Mapping of Wetland Extent and Changes in Wetland Extent in Queensland. What does lacustrine and palustrine mean?What is an ‘Intertidal/Subtidal’ wetland system?In Queensland Wetland Data there may be areas identified as having a wetland system of ‘Intertidal/Subtidal’. These areas contain intertidal wetlands, subtidal wetlands, or a combination of both. Currently, there is insufficient information available to classify which parts of the area are intertidal and which parts are subtidal wetlands. How did you decide where a riverine wetland ends and an intertidal wetland begins?The primary mechanism used to distinguish between systems influenced by tidal salinity (intertidal and subtidal) and those not influenced by tidal salinity (riverine, palustrine and lacustrine) is water sampling to determine where salinity drops below 5ppt. However, as the Queensland wetland mapping is compiled remotely using existing data, it is necessary to use mapping surrogates. Where the cut-off between saline and fresh water is across a channel, the surrogates used to determine the mean high water springs (MHWS) were the presence of a barrier such as a barrage or weir, or the line between estuarine and non-estuarine vegetation. Where the cut-off is outside a channel, the surrogate used to determine the highest astronomical tide (HAT) was the boundary between estuarine and other types of vegetation or water. For more information go to the Queensland Wetland Mapping Method - A Method to Provide Baseline Mapping of Wetland Extent and Changes in Wetland Extent in Queensland. How did you decide where the marine/subtidal wetlands end?According to the Queensland Wetlands Program wetland definition subtidal wetlands extend from the low tide limit to a depth of 6m below the Lowest Astronomical Tide. However, a map of the 6m bathymetric (ocean depth contour) does not currently exist for Queensland, therefore the 3 nautical mile limit has been used to draw the edge of the subtidal wetlands in Queensland waters on the Queensland wetland mapping. If the 6m bathymetric data becomes available in the future the Queensland wetland mapping will be updated. What are pre-clearing wetlands?Pre-clearing wetland mapping represents the maximum areal extent of a wetland prior to land clearing. This is consistent with the definition of pre-clearing regional ecosystems “Pre-clearing vegetation or regional ecosystem is defined as the vegetation or regional ecosystem present before clearing”[1]. Pre-clearing "generally equates to terms such as ‘pre-1750’ or ‘pre-European’ used elsewhere”[1]. The extent of pre-clearing wetland regional ecosystems is extracted from the Biodiversity of pre-clearing and remnant regional ecosystem data based on their wetland system classification in the accompanying Regional Ecosystem Description Database. For more information, see Queensland Wetland Mapping Method - A Method to Provide Baseline Mapping of Wetland Extent and Changes in Wetland Extent in Queensland. Are peat wetlands included in the Wetlands mapping?Queensland Wetland Data contains information on substrate composition in freshwater wetland systems (GEO_COMP_H) and in intertidal wetland systems (SUB_CMP). This information includes the identification of wetland systems with peat substrate based on expert assessments in accordance with the definition detailed in the Australian Soil and Land Survey Field Handbook. WetlandMaps provides a unique view of Queensland Wetland Data whereby the map is symbolised on substrate composition to highlight the extent of wetlands across Queensland with peat substrate. Specific Queensland wetland mapping geographic information system FAQsWhat formats is the Queensland wetland mapping data available in?The Queensland wetland mapping is available as a file geodatabase, shapefile, KML, and Geopackage from QSpatial and the Queensland Government Open Data Portal. I am not using an ESRI GIS program. How can I view the Queensland wetland mapping?If you are not using an ESRI GIS program, you should access the inbuilt or online help file for your program to determine which format is the most suitable for your program. Some programs, such as QGIS and MapInfo, can use one or more provided formats directly. For others, such as AutoCAD, you may need to use a utility to import the file. There are also a number of free programs available on the internet (e.g. ArcExplorer which is available from ESRI) that will allow you to perform simple operations such as viewing, navigating and querying shape files. You can also use online visualisation platforms to view Queensland wetland mapping including WetlandMaps and the Queensland Globe. How is the digital wetland mapping projected?The geodatabase coordinates are geographic. More specifically, they are geodetic longitude and latitude (EPSG: 4283). The data includes wetland area in hectares for analysis; however, if you would like to measure distances in square kilometres you will need to project the data to an appropriate coordinate system. How can I extend my use of the Queensland wetland mapping data?The Queensland wetland mapping can be imported into other GIS analyses as needed by the user. It must be noted that the disclaimers on the metadata should be maintained on all products produced. Data should be used appropriately and at the recommended scale. References
Last updated: 28 April 2025 This page should be cited as: Department of Environment, Science and Innovation, Queensland (2025) Queensland wetland mapping FAQs, WetlandInfo website, accessed 8 May 2025. Available at: https://wetlandinfo.des.qld.gov.au/wetlands/facts-maps/wetland-background/faq/ |

 — Department of the Environment, Tourism, Science and Innovation


