

|
|
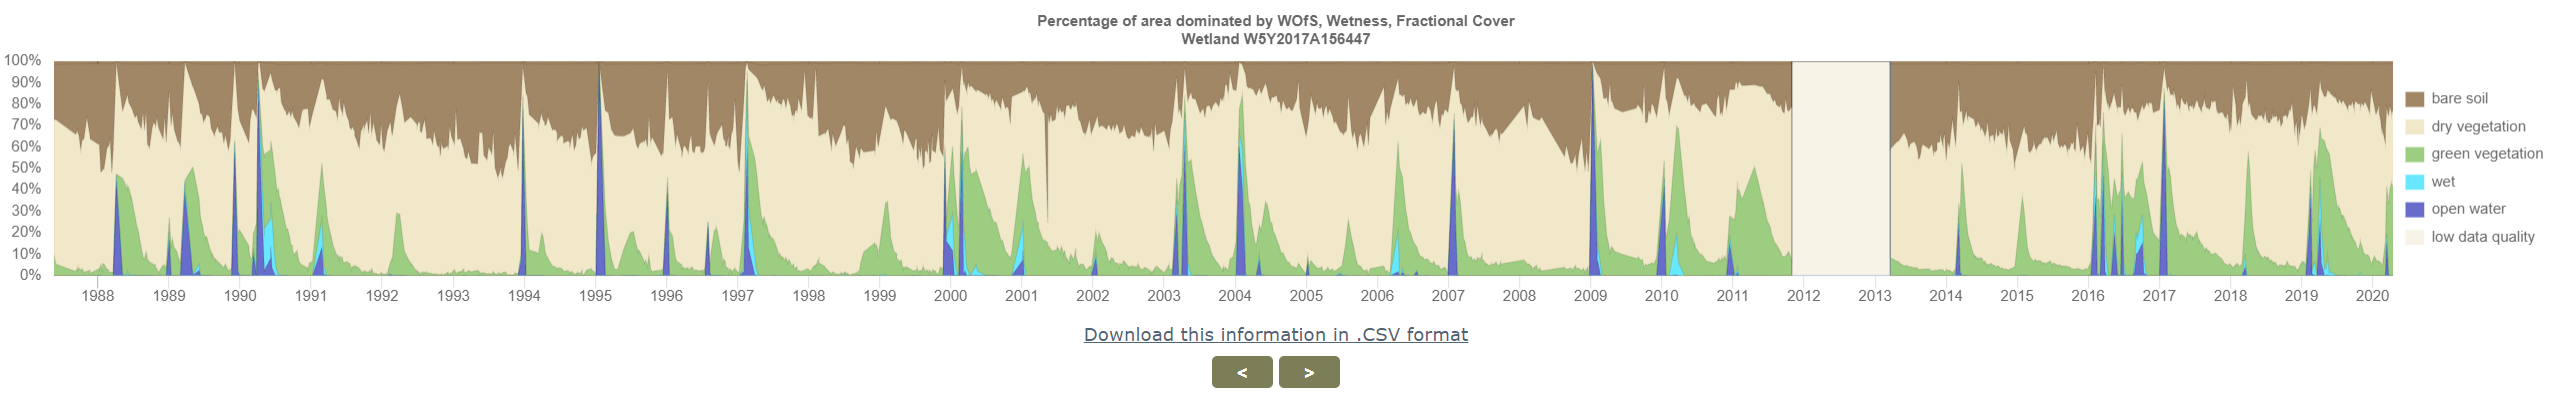
Digital Earth Australia (DEA) Wetlands Insight Tool (QLD)The Queensland Government has worked with the Australian Government (Geoscience Australia) to develop the DEA Wetlands Insight Tool (QLD)[1]. The Wetlands Insight data display on WetlandMaps summarises how the amount of open water, wet, green vegetation, dry vegetation and bare soil varies over time within each wetland. This information provides wetland managers and scientists with a historical baseline of wetland dynamics based on Landsat data starting from 1987.
Quick facts
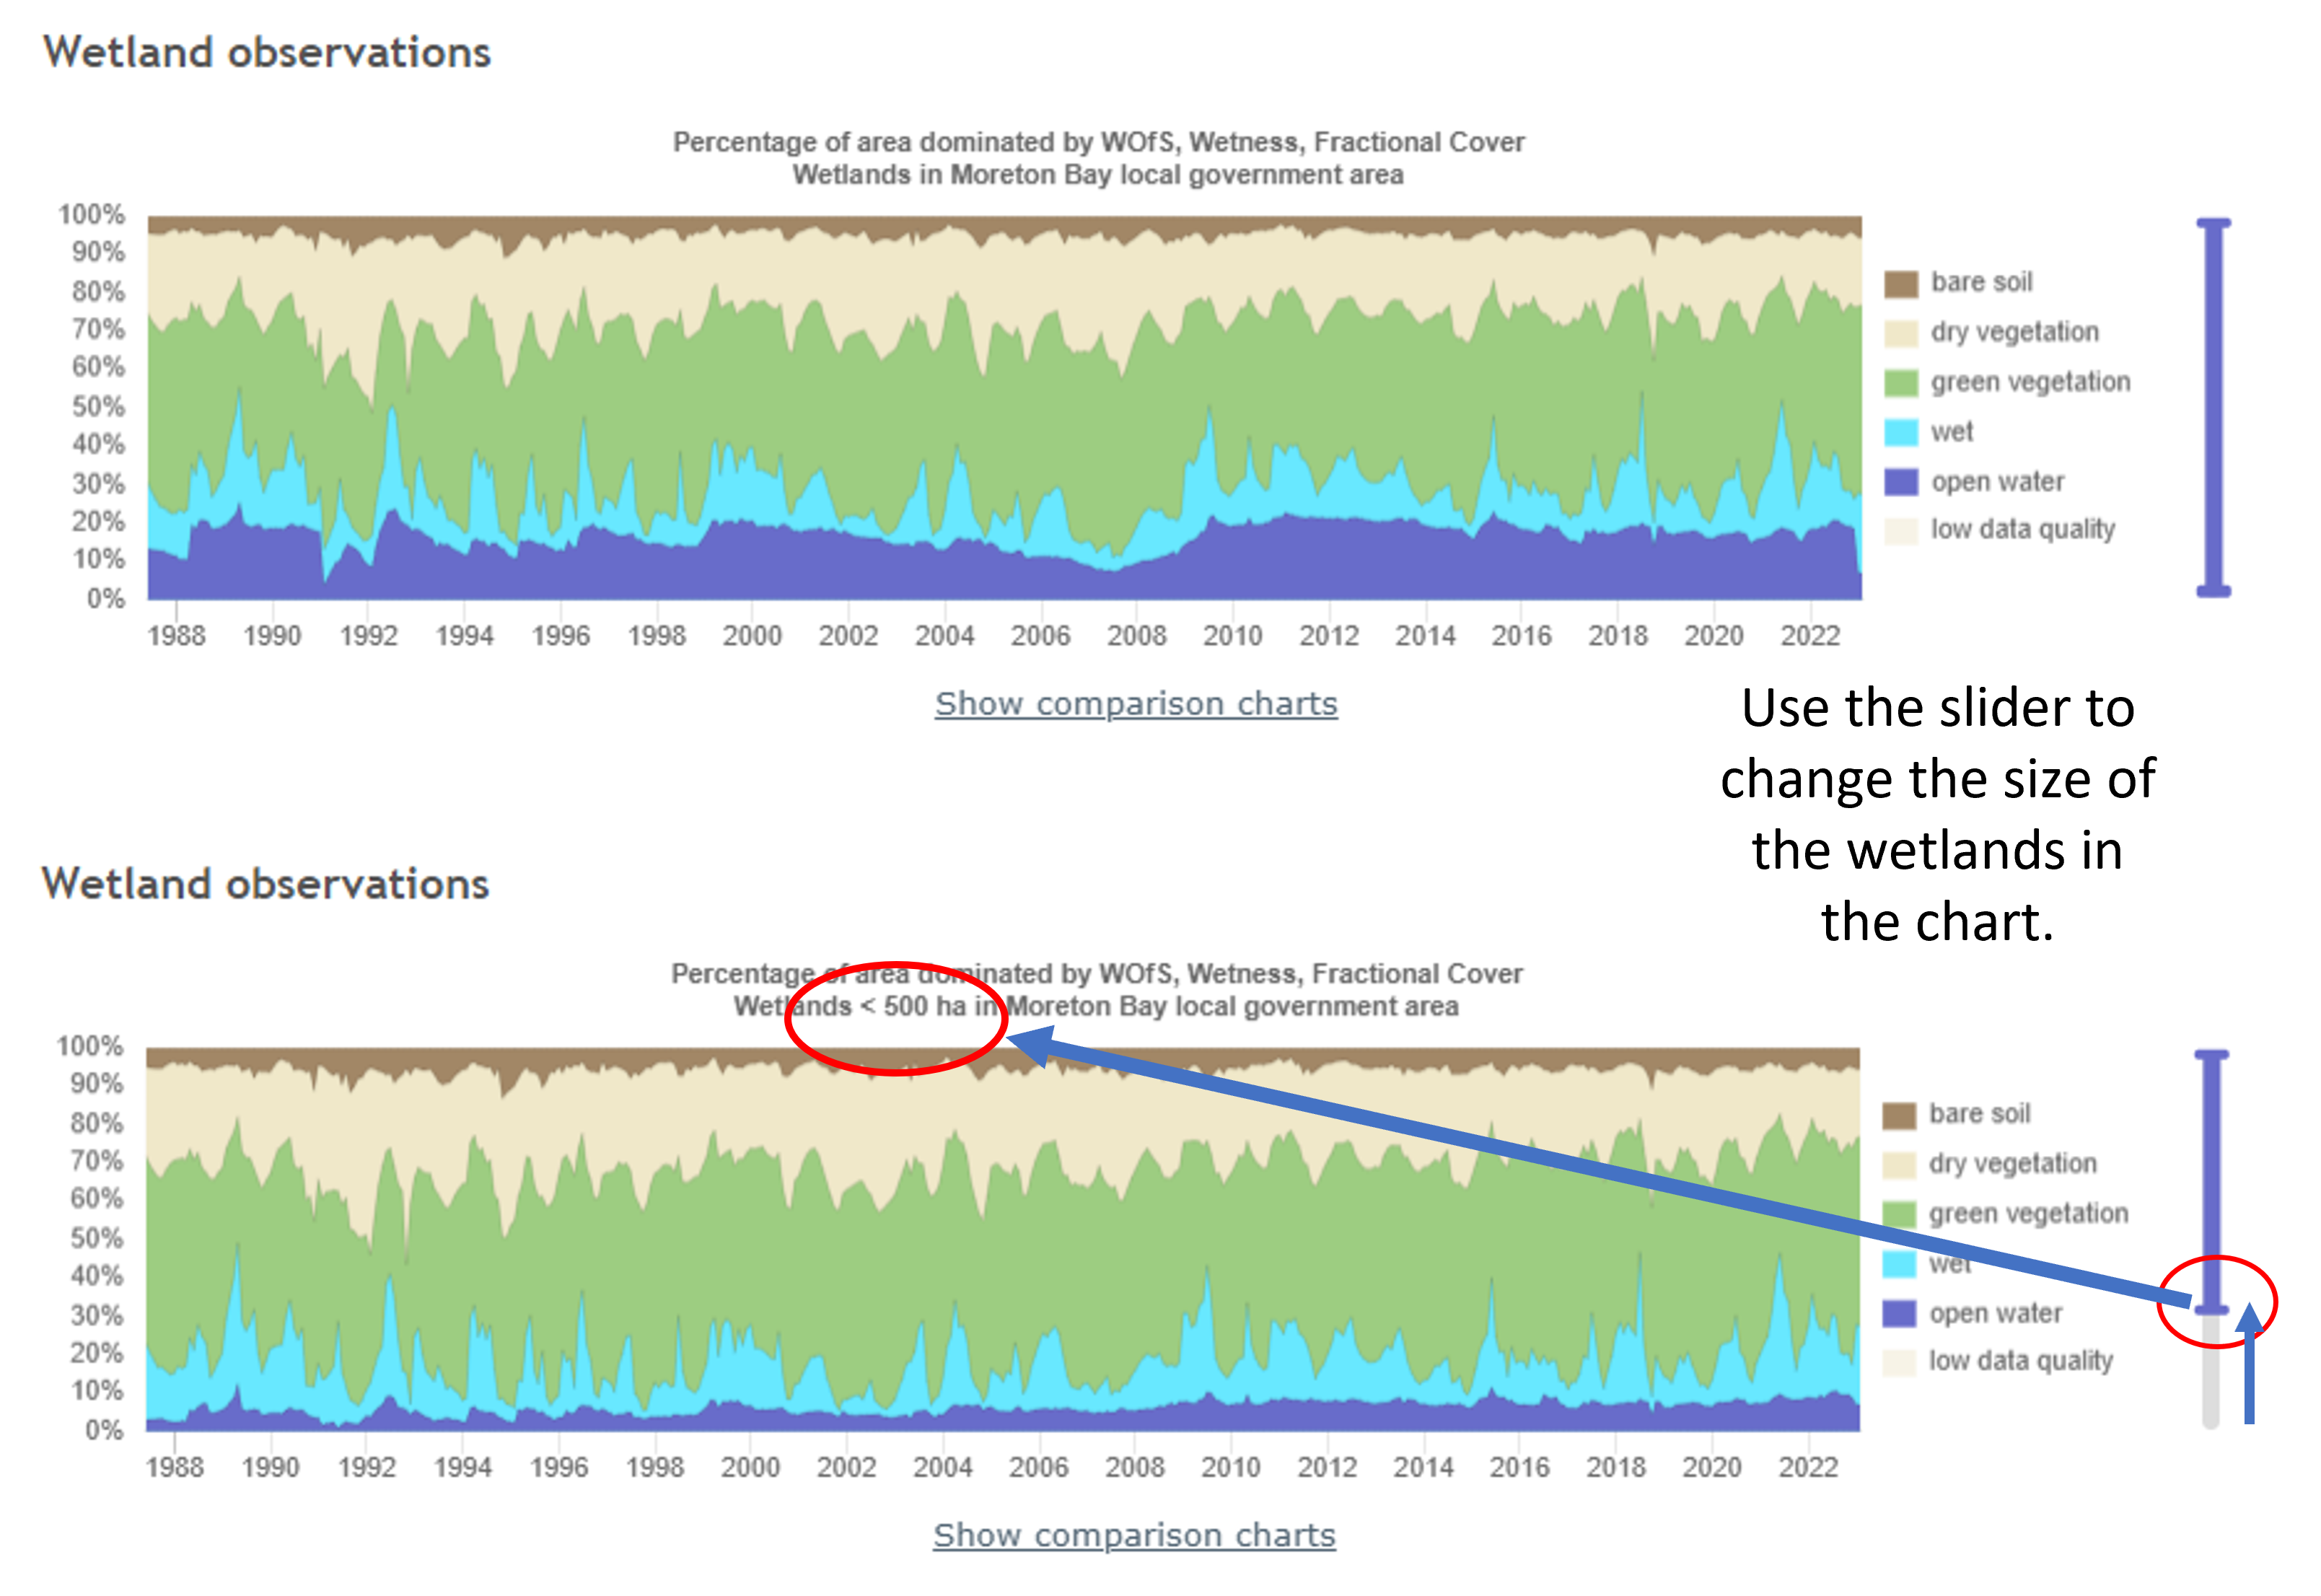
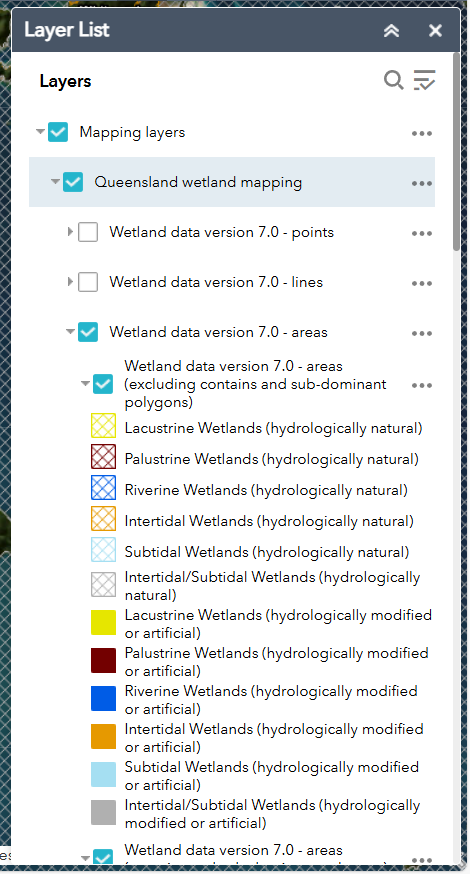
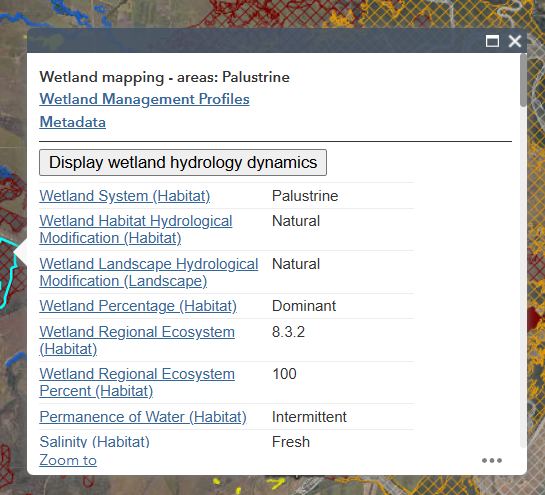
The data developed via the Wetlands Insight Tool presents a combined view of Water Observations from Space, Tasseled Cap Wetness and Fractional Cover measurements from the Landsat series of satellites for each palustrine and lacustrine wetland in the Queensland wetland mapping*. The data is summarised as a series of hydrological attributes and visualised as stacked line plots. Please noteThe DEA Wetlands Insight Tool is based on remotely sensed satellite imagery and requires field validation so care should be used when interpreting results as increases/decreases in cover types can (1) conflate technical limitations with on-ground change, and/or (2) be associated with different processes. For example an increase in green cover could indicate canopy recovery of desirable wetland species or an increase in the presence of invasive weeds. Data quality may vary. The stack line plot will display periods of low data quality (defined as less than 4 observations in a 6 month period) as pale overlays. An attribute on data quality has also been provided in the mapping data to indicate data quality. The period between when Landsat 5 ceased operations (November 2011) and Landsat 8 data became routinely available (May 2013) has been identified in the stacked line plot as a low data quality period. The 30-metre resolution of Landsat imposes an intrinsic limitation on the Wetlands Insight Tool. Wetland areas that are small, or long and narrow in nature are likely to be inaccurate (due to inclusion of neighbouring non-wetland pixels) or difficult to interpret (stack line plots for areas with a small number of pixels have sharp steps in them). For more information - see Wetlands Insight Tool: Characterising the Surface Water and Vegetation Cover Dynamics of Individual Wetlands Using Multidecadal Landsat Satellite Data. How to use - WetlandMapsTo access hydrological attributes and the stacked line plot
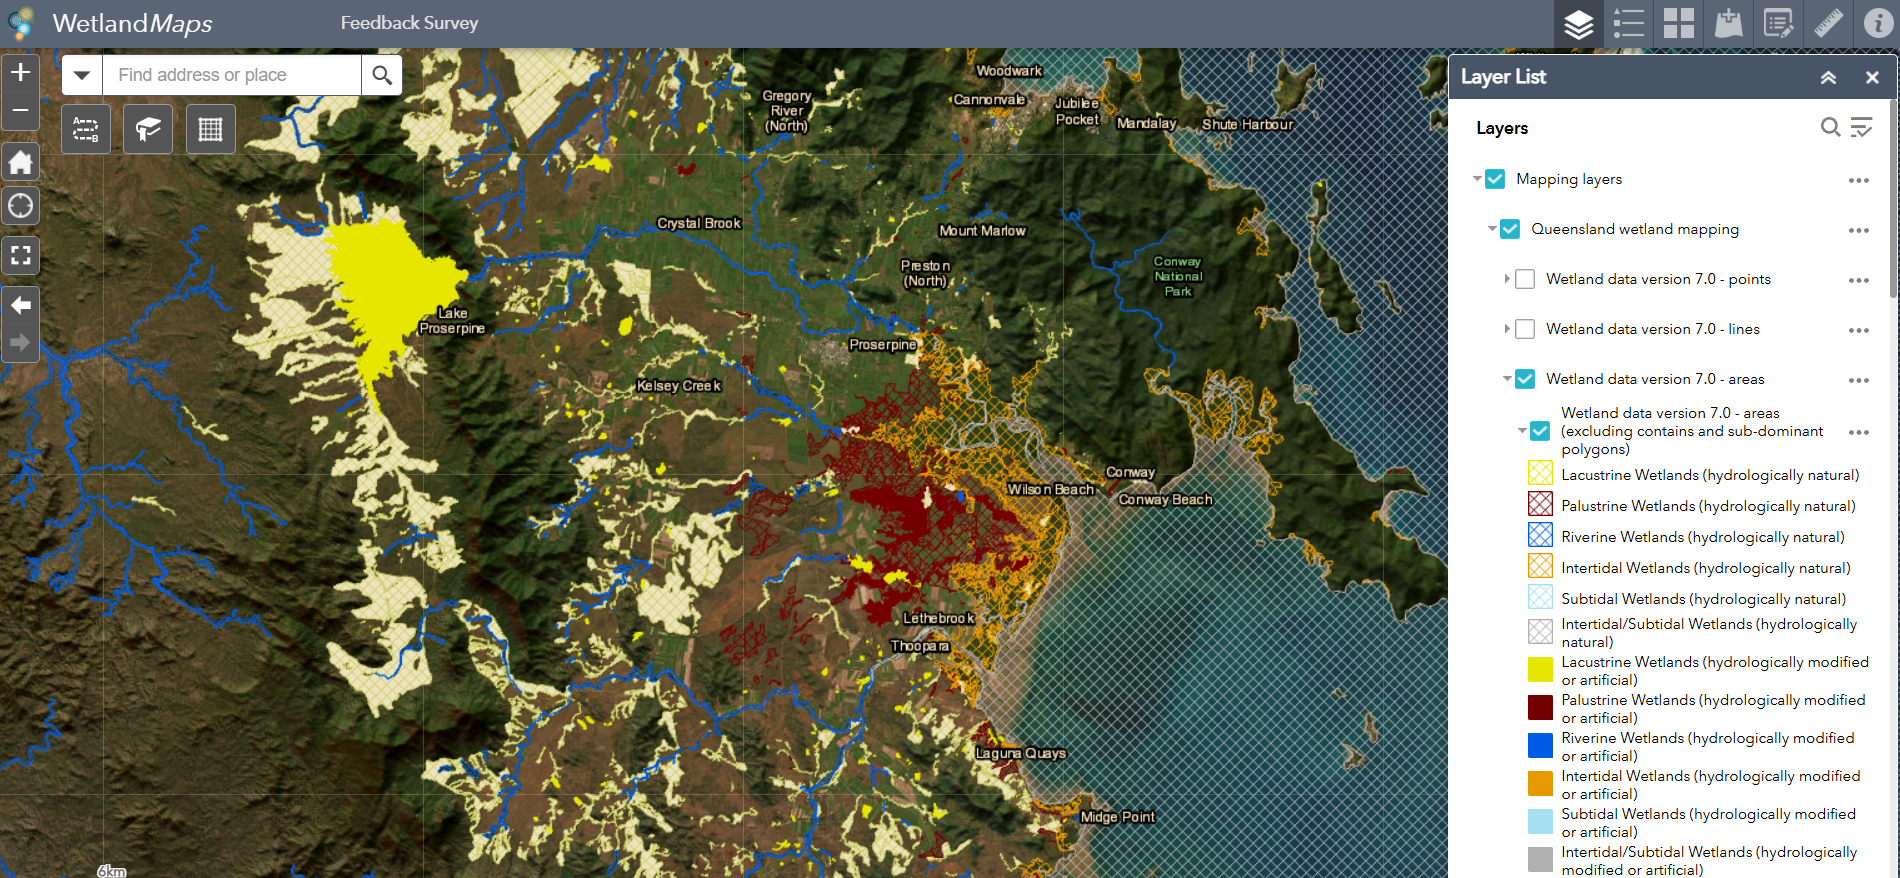
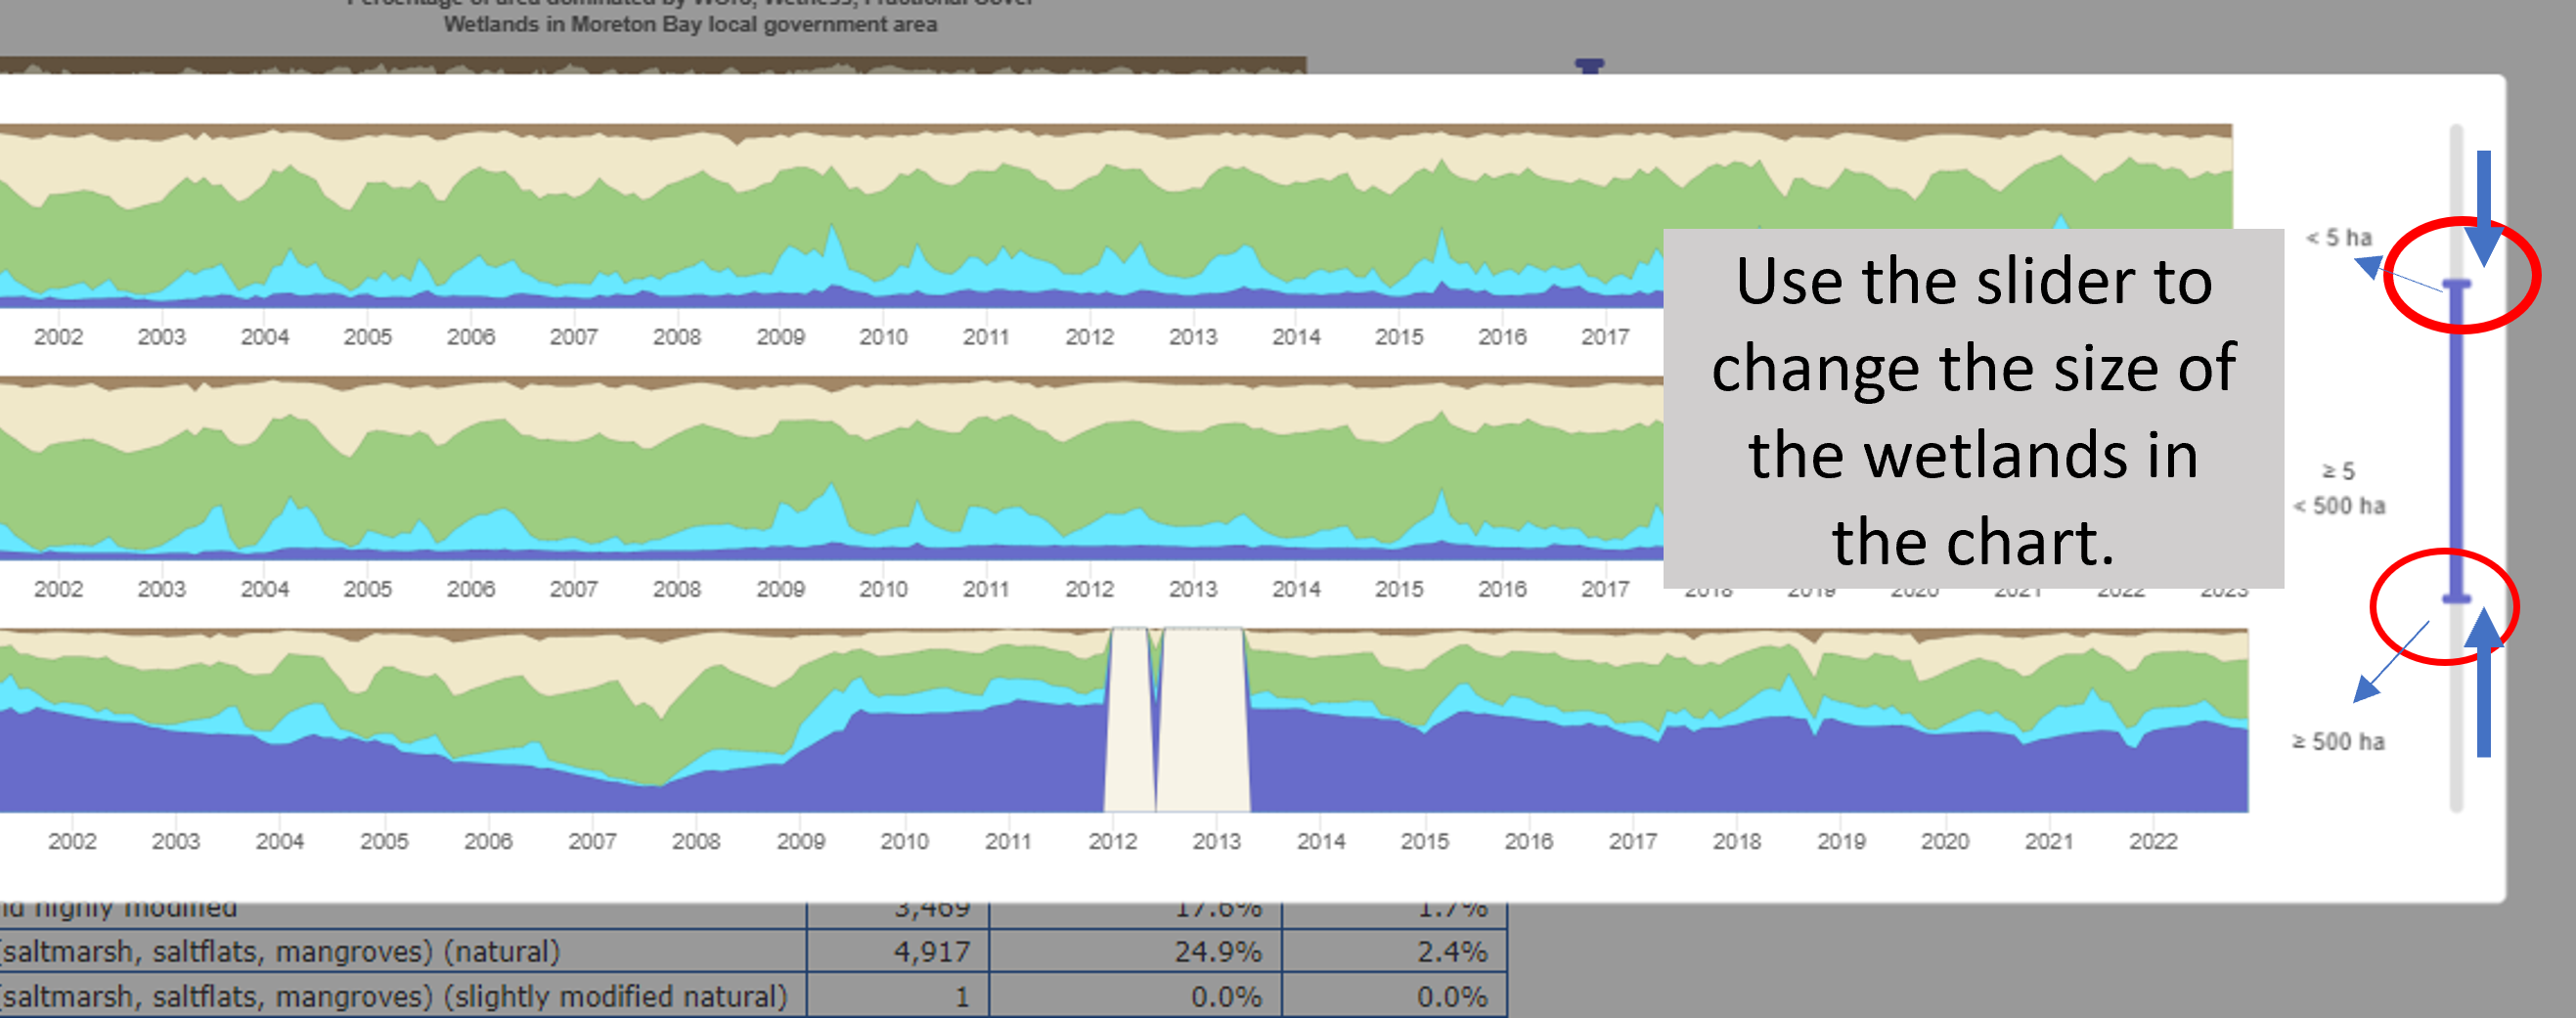
* Note that a minimise size threshold is applied due to limitations in the spatial resolution of satellite imagery. How to use - WetlandSummaryWetlandSummary contains a stacked line plot chart for every area of interest provided (such as Local Government Area, or Drainage Basin). The stacked line plot charts display the amount of open water, wet, green vegetation, dry vegetation and bare soil over time within each wetland. For WetlandSummary, the stacked line plot charts visually represent all the wetland areas in the area of interest. The stacked line plot charts have an interactive slider that helps to display the chart with the wetland size of interest (for example, to omit large structures like dams). This allows the user to understand the open water within the identified wetlands of an area (termed fractional cover). The stacked line plot charts can be used to visualise droughts, major hydrological events, floods and how water in wetlands is changing over time. To access hydrological attributes and the stacked line plot:
Please note the stacked line plot charts are a data visualisation tool - any analysis of this data should be undertaken using the source data from GeoScience Australia. DEA Wetlands Insight Tool - NotebookGeoscience Australia has published a Github notebook page with instructions on how to generate customised charts based on an area of interest. References
Last updated: 8 May 2025 This page should be cited as: Department of Environment, Science and Innovation, Queensland (2025) Digital Earth Australia (DEA) Wetlands Insight Tool (QLD), WetlandInfo website, accessed 8 May 2025. Available at: https://wetlandinfo.des.qld.gov.au/wetlands/facts-maps/wetland-background/insight.html |


Site footer

 — Department of the Environment, Tourism, Science and Innovation