

|
|
Wetlands hydro-climate toolThe wetlands hydro-climate tool (hydro-climate tool) explains the representativeness of satellite imaged inundation used to develop the wetland mapping. The tool can interrogate and attribute the mean zonal rainfall, mean zonal run-off and stream flow conditions for each image date when data are available. The information can be used to guide ecological assessments and aquatic connectivity studies, as well as the selection of imagery, based on probabilities of exceedence with reference to already imaged inundation extents.
Quick facts
Wetlands hydro-climate toolSupporting the mapping is the Wetlands hydro-climate tool (with full support documents). This is an interactive tool that shows historic hydrological conditions for wetlands in the Queensland wetland mapping. The tool provides historical context to evaluate the representativeness and variability of the hydro-climatic conditions that are relevant to wetland inundation and the extent of inundation. About the data and informationThe hydro-climate tool provides users with regional indices of mean zonal rainfall and run-off, normalised gauged stream discharge and height and the probability for observation occurrence for specific dates and reference time scales. The wetland mapping may show the distribution of imaged inundation but it cannot identify the potential quantity of rainfall or stream flow that caused the inundation or the representativeness of these observations (e.g. in terms of historical seasonal conditions or probability of occurrence). This hydro-climate tool enables the extraction of this information through the use of hydro-climate data series and reference systems. The tool uses:
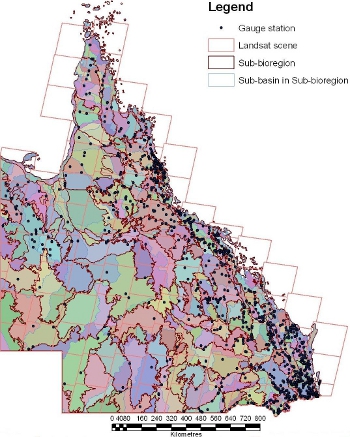
This tool combines quality controlled data at 4 time scales (daily, weekly, monthly and annually within subregions). Data (arithmetic averages) are stored at a daily scale and interpreted through non-parametric annualised reference series (also called mean zonal rainfall or flow duration or probability of exceedence curves) for each time scale. Exceedence curves are based on the driest 5%, wettest 95% and median (50%) conditions for each year. The median series include the 90% confidence intervals to depict its precision. The exceedence curves represent, as faithfully as the data will allow, different hydro-climate regimes, which can be used with linked reference data to derive indices and to identify transitions in conditions. The source data are zonal statistics obtained using complete annual records within 120 sub-bioregions (mean zonal rainfall and mean zonal run-off data) and up to 253 sub-basin drainage areas nested within sub-bioregions (stream yield and height). Product supportMethodUsers should read the method Hydrological Characterisation for Wetlands and Wetland Imagery to understand the development of the data and its range of uses. Frequently Asked QuestionsRefer to the Frequently Asked Questions. Users guideUsers guide to attribute and evaluate hydro-climatic conditions and variability using the WetlandInfo tools for hydrological characterisation for wetlands and wetland imagery. Wetland Hydrological Characterisation fact sheetWetland Hydrological Characterisation Additional informationDisclaimerThe climate and hydro-climate information provided here is provided to qualify potential surface water conditions. The effectiveness of the information depends upon previous seasonal conditions, within season and within zone variations, mean zonal rainfall intensity, temperatures, soil type and landscape condition and time of year. WARNING: The information is limited to and extrapolated across the zonal extent of assessment. More detailed information is required for assessments at a location or for a specific localised climatic or flood event. Extracted information should be treated as descriptive rather than predictive. Stream gauge data is distributed unevenly while mean zonal rainfall and mean zonal run-off are provided evenly across the state. This tool is not suitable for water resource planning and allocation. The source and derived data are copyright of the State of Queensland. Neither the Queensland Government nor the Department of the Environment, Tourism, Science and Innovation (DETSI) accept liability for any decisions made or actions taken on the basis of this information. In particular, users are advised to refer to the current acts and regulations of the Queensland Parliament which DETSI administers and current DETSI policies and practices. Pages under this sectionLast updated: 22 March 2013 This page should be cited as: Department of Environment, Science and Innovation, Queensland (2013) Wetlands hydro-climate tool, WetlandInfo website, accessed 8 May 2025. Available at: https://wetlandinfo.des.qld.gov.au/wetlands/resources/tools/hydro-climate/ |
Site footer

 — Department of the Environment, Tourism, Science and Innovation