

|
|
Moreton Bay Marine ParkAccess wetland mapping in PDF and KML format by selecting the desired 100K map tile below or download the data via the Queensland Government Information Service. The below map is for visual representation purposes only. For more detailed mapping, please download the boundary KML. Drag this bar to relocate the map on your screen Open WetlandMaps interactive map server
Overview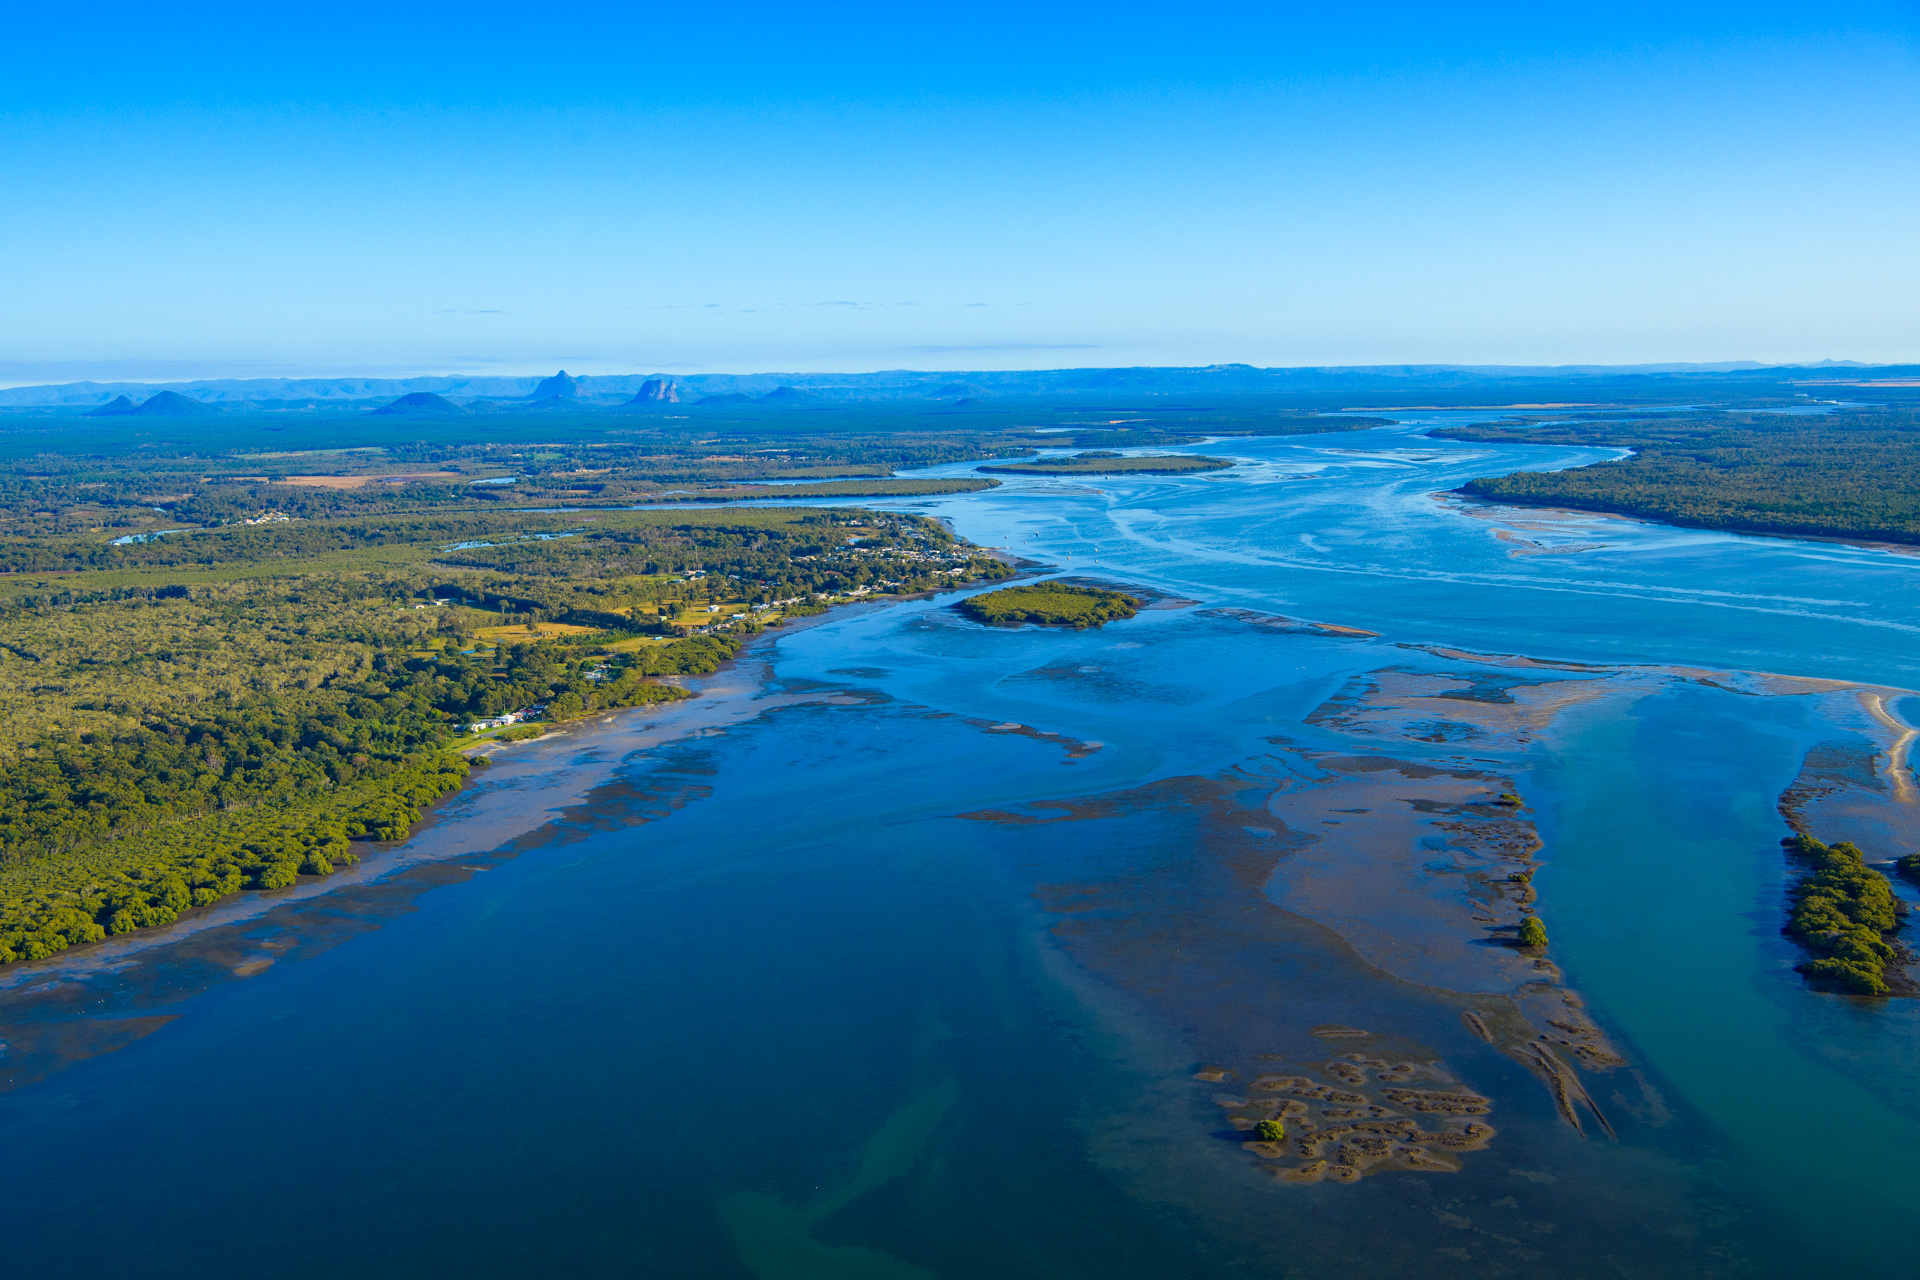    The Moreton Bay Marine Park is a State marine park, managed by Queensland Parks and Wildlife Service (QPWS). First declared in 1993, the Moreton Bay Marine Park covers over 3400km2 and stretches 125km from Caloundra to the Gold Coast. The Moreton Bay Marine Park takes in most of the Bay’s tidal waters, including many river estuaries, and extends seawards to the limit of Queensland waters. It is an area of unique conservation values and high biodiversity. The Moreton Bay Marine Park protects natural and cultural values across a range of marine and coastal environments including rocky shores, coral reefs, mangroves, seagrass meadows and sandy beaches and the internationally significant wetlands of the Moreton Bay Ramsar site. These habitats provide important seasonal resources for migratory wading birds, humpback whales and marine turtles. Permanent resident species include dolphins, dugong, shorebirds, grey nurse sharks and various fish species. Eleven Fish Habitat Areas, declared under the Fisheries Act 1994 to protect habitat important for the State’s fisheries from the impacts of coastal development, are also present within the marine park. The marine park is used for a wide range of activities, from fishing and recreation to defence activities and scientific research. The Moreton Bay Marine Park Zoning Plan provides the management detail for the protection of the natural, cultural and use values of the marine park and aims to balance its ecologically sustainable use. It is subordinate legislation under the Marine Parks Act 2004, the purpose of which is conservation of the marine environment. The zoning plan establishes and defines the location of a network of spatially defined zones which afford different levels of protection and a network of designated areas that protect specific values at particular locations, and specifies the associated zone and designated area entry and use provisions for each. The zoning plan is the primary tool used to manage the marine park, supported by public education programs, signs, permits, compliance programs, routine surveillance and scientific monitoring. Read more about the marine’s park’s management and zoning. Catchment stories
|
| System | Area (ha) | % wetlands area | % total area |
|---|---|---|---|
| Total | 15,674 | 100.0% | 4.6% |
| Artificial and highly modified | 2 | 0.0% | 0.0% |
| Intertidal (saltmarsh, saltflats, mangroves) (natural) | 15,183 | 96.9% | 4.4% |
| Intertidal (saltmarsh, saltflats, mangroves) (slightly modified) | < 1 | 0.0% | 0.0% |
| Lacustrine (natural) | 0 | 0.0% | 0.0% |
| Lacustrine (slightly modified) | 0 | 0.0% | 0.0% |
| Lacustrine (unknown degree of modification) | 0 | 0.0% | 0.0% |
| Palustrine (natural) | 469 | 3.0% | 0.1% |
| Palustrine (slightly modified) | < 1 | 0.0% | 0.0% |
| Riverine | 18 | 0.1% | 0.0% |
| Intertidal (saltmarsh, saltflats, mangroves) (highly modified) | 0 | 0.0% | 0.0% |
| Intertidal (saltmarsh, saltflats, mangroves) (natural) | 15,183 | 96.9% | 4.4% |
| Intertidal (saltmarsh, saltflats, mangroves) (slightly modified) | < 1 | 0.0% | 0.0% |
| Lacustrine (artificial) | < 1 | 0.0% | 0.0% |
| Lacustrine (highly modified) | 2 | 0.0% | 0.0% |
| Lacustrine (natural) | 0 | 0.0% | 0.0% |
| Lacustrine (slightly modified) | 0 | 0.0% | 0.0% |
| Lacustrine (unknown degree of modification) | 0 | 0.0% | 0.0% |
| Palustrine (artificial) | 0 | 0.0% | 0.0% |
| Palustrine (highly modified) | 0 | 0.0% | 0.0% |
| Palustrine (natural) | 469 | 3.0% | 0.1% |
| Palustrine (slightly modified) | < 1 | 0.0% | 0.0% |
| Riverine (artificial) | 0 | 0.0% | 0.0% |
| Riverine (highly modified) | 0 | 0.0% | 0.0% |
| Riverine (natural) | 18 | 0.1% | 0.0% |
| Riverine (slightly modified) | 0 | 0.0% | 0.0% |
For definitions of artificial, highly modified, modified, slightly modified and natural wetlands, see the Queensland Wetland Mapping Method - A Method to Provide Baseline Mapping of Wetland Extent and Changes in Wetland Extent in Queensland.
| Habitat | Area (ha) | % wetlands area | % total area |
|---|---|---|---|
| Total | 15,581 | 100.0% | 4.5% |
| Mangroves - Casuarina | 588 | 3.8% | 0.2% |
| Mangroves - other | 12,465 | 80.0% | 3.6% |
| Salt marsh and salt flats | 2,059 | 13.2% | 0.6% |
| Arid and semi-arid saline lake | 0 | 0.0% | 0.0% |
| Arid and semi-arid floodplain lake | 0 | 0.0% | 0.0% |
| Arid and semi-arid permanently inundated lake | 0 | 0.0% | 0.0% |
| Coastal and sub-coastal floodplain lake | 0 | 0.0% | 0.0% |
| Coastal and sub-coastal non-floodplain rock lake | 0 | 0.0% | 0.0% |
| Coastal and sub-coastal non-floodplain sand (window) lake | 0 | 0.0% | 0.0% |
| Coastal and sub-coastal non-floodplain sand (perched) lake | 0 | 0.0% | 0.0% |
| Coastal and sub-coastal non-floodplain soil lake | 0 | 0.0% | 0.0% |
| Arid and semi-arid saline swamp | 0 | 0.0% | 0.0% |
| Arid and semi-arid floodplain tree swamp | 0 | 0.0% | 0.0% |
| Arid and semi-arid floodplain shrub swamp | 0 | 0.0% | 0.0% |
| Arid and semi-arid floodplain grass, sedge and herb swamp | 0 | 0.0% | 0.0% |
| Arid and semi-arid non-floodplain tree swamp | 0 | 0.0% | 0.0% |
| Arid and semi-arid non-floodplain shrub swamp | 0 | 0.0% | 0.0% |
| Arid and semi-arid non-floodplain grass, sedge and herb swamp | 0 | 0.0% | 0.0% |
| Arid and semi-arid other non-floodplain swamp | 0 | 0.0% | 0.0% |
| Arid and semi-arid Great Artesian Basin fed spring swamp | 0 | 0.0% | 0.0% |
| Coastal and sub-coastal non-floodplain tree (Melaleuca and Eucalypt) swamp | 86 | 0.6% | 0.0% |
| Coastal and sub-coastal non-floodplain wet heath swamp | 6 | 0.0% | 0.0% |
| Coastal and sub-coastal non-floodplain grass, sedge, and herb swamp | 18 | 0.1% | 0.0% |
| Coastal and sub-coastal other non-floodplain swamp | 0 | 0.0% | 0.0% |
| Coastal and sub-coastal floodplain tree (Melaleuca and Eucalypt) swamp | 358 | 2.3% | 0.1% |
| Coastal and sub-coastal floodplain grass, sedge, and herb swamp | < 1 | 0.0% | 0.0% |
| Coastal and sub-coastal floodplain wet heath swamp | < 1 | 0.0% | 0.0% |
| Coastal and sub-coastal other floodplain swamp | 0 | 0.0% | 0.0% |
| Coastal and sub-coastal tree (palm) swamp | 0 | 0.0% | 0.0% |
| Unknown - Swamp - Arid and semi-arid | 0 | 0.0% | 0.0% |
| Unknown - Swamp - Coastal and sub-coastal | 0 | 0.0% | 0.0% |
| Mangroves - Casuarina (natural) | 588 | 3.8% | 0.2% |
| Mangroves - Casuarina (slightly modified) | 0 | 0.0% | 0.0% |
| Mangroves - other (natural) | 12,464 | 80.0% | 3.6% |
| Mangroves - other (slightly modified) | < 1 | 0.0% | 0.0% |
| Salt marsh and salt flats (natural) | 2,059 | 13.2% | 0.6% |
| Salt marsh and salt flats (slightly modified) | < 1 | 0.0% | 0.0% |
| Arid and semi-arid saline lake (natural) | 0 | 0.0% | 0.0% |
| Arid and semi-arid saline lake (slightly modified) | 0 | 0.0% | 0.0% |
| Arid and semi-arid floodplain lake (natural) | 0 | 0.0% | 0.0% |
| Arid and semi-arid floodplain lake (slightly modified) | 0 | 0.0% | 0.0% |
| Arid and semi-arid permanently inundated lake (slightly modified) | 0 | 0.0% | 0.0% |
| Coastal and sub-coastal floodplain lake (natural) | 0 | 0.0% | 0.0% |
| Coastal and sub-coastal floodplain lake (slightly modified) | 0 | 0.0% | 0.0% |
| Coastal and sub-coastal non-floodplain rock lake (natural) | 0 | 0.0% | 0.0% |
| Coastal and sub-coastal non-floodplain rock lake (slightly modified) | 0 | 0.0% | 0.0% |
| Coastal and sub-coastal non-floodplain sand (window) lake (natural) | 0 | 0.0% | 0.0% |
| Coastal and sub-coastal non-floodplain sand (window) lake (slightly modified) | 0 | 0.0% | 0.0% |
| Coastal and sub-coastal non-floodplain sand (perched) lake (natural) | 0 | 0.0% | 0.0% |
| Coastal and sub-coastal non-floodplain soil lake (natural) | 0 | 0.0% | 0.0% |
| Coastal and sub-coastal non-floodplain soil lake (slightly modified) | 0 | 0.0% | 0.0% |
| Arid and semi-arid saline swamp (natural) | 0 | 0.0% | 0.0% |
| Arid and semi-arid saline swamp (slightly modified) | 0 | 0.0% | 0.0% |
| Arid and semi-arid floodplain tree swamp (natural) | 0 | 0.0% | 0.0% |
| Arid and semi-arid floodplain tree swamp (slightly modified) | 0 | 0.0% | 0.0% |
| Arid and semi-arid floodplain shrub swamp (natural) | 0 | 0.0% | 0.0% |
| Arid and semi-arid floodplain shrub swamp (slightly modified) | 0 | 0.0% | 0.0% |
| Arid and semi-arid floodplain grass, sedge and herb swamp (natural) | 0 | 0.0% | 0.0% |
| Arid and semi-arid floodplain grass, sedge and herb swamp (slightly modified) | 0 | 0.0% | 0.0% |
| Arid and semi-arid non-floodplain tree swamp (natural) | 0 | 0.0% | 0.0% |
| Arid and semi-arid non-floodplain tree swamp (slightly modified) | 0 | 0.0% | 0.0% |
| Arid and semi-arid non-floodplain shrub swamp (natural) | 0 | 0.0% | 0.0% |
| Arid and semi-arid non-floodplain shrub swamp (slightly modified) | 0 | 0.0% | 0.0% |
| Arid and semi-arid non-floodplain grass, sedge and herb swamp (natural) | 0 | 0.0% | 0.0% |
| Arid and semi-arid non-floodplain grass, sedge and herb swamp (slightly modified) | 0 | 0.0% | 0.0% |
| Arid and semi-arid other non-floodplain swamp (natural) | 0 | 0.0% | 0.0% |
| Arid and semi-arid other non-floodplain swamp (slightly modified) | 0 | 0.0% | 0.0% |
| Arid and semi-arid Great Artesian Basin fed spring swamp (natural) | 0 | 0.0% | 0.0% |
| Arid and semi-arid Great Artesian Basin fed spring swamp (slightly modified) | 0 | 0.0% | 0.0% |
| Coastal and sub-coastal non-floodplain tree (Melaleuca and Eucalypt) swamp (natural) | 86 | 0.6% | 0.0% |
| Coastal and sub-coastal non-floodplain tree (Melaleuca and Eucalypt) swamp (slightly modified) | 0 | 0.0% | 0.0% |
| Coastal and sub-coastal non-floodplain wet heath swamp (natural) | 6 | 0.0% | 0.0% |
| Coastal and sub-coastal non-floodplain wet heath swamp (slightly modified) | 0 | 0.0% | 0.0% |
| Coastal and sub-coastal non-floodplain grass, sedge, and herb swamp (natural) | 18 | 0.1% | 0.0% |
| Coastal and sub-coastal non-floodplain grass, sedge, and herb swamp (slightly modified) | 0 | 0.0% | 0.0% |
| Coastal and sub-coastal other non-floodplain swamp (natural) | 0 | 0.0% | 0.0% |
| Coastal and sub-coastal other non-floodplain swamp (slightly modified) | 0 | 0.0% | 0.0% |
| Coastal and sub-coastal floodplain tree (Melaleuca and Eucalypt) swamp (natural) | 358 | 2.3% | 0.1% |
| Coastal and sub-coastal floodplain tree (Melaleuca and Eucalypt) swamp (slightly modified) | < 1 | 0.0% | 0.0% |
| Coastal and sub-coastal floodplain grass, sedge, and herb swamp (natural) | < 1 | 0.0% | 0.0% |
| Coastal and sub-coastal floodplain grass, sedge, and herb swamp (slightly modified) | 0 | 0.0% | 0.0% |
| Coastal and sub-coastal floodplain wet heath swamp (natural) | < 1 | 0.0% | 0.0% |
| Coastal and sub-coastal floodplain wet heath swamp (slightly modified) | 0 | 0.0% | 0.0% |
| Coastal and sub-coastal other floodplain swamp (natural) | 0 | 0.0% | 0.0% |
| Coastal and sub-coastal other floodplain swamp (slightly modified) | 0 | 0.0% | 0.0% |
| Coastal and sub-coastal tree (palm) swamp (natural) | 0 | 0.0% | 0.0% |
| Coastal and sub-coastal tree (palm) swamp (slightly modified) | 0 | 0.0% | 0.0% |
| Unknown - Swamp - Arid and semi-arid (natural) | 0 | 0.0% | 0.0% |
| Unknown - Swamp - Arid and semi-arid (slightly modified) | 0 | 0.0% | 0.0% |
| Unknown - Swamp - Coastal and sub-coastal (natural) | 0 | 0.0% | 0.0% |
| Unknown - Swamp - Coastal and sub-coastal (slightly modified) | 0 | 0.0% | 0.0% |
Disclaimer
Areas do not include marine or estuarine waters but do include estuarine wetland vegetation
(e.g. mangroves and tidal flats).
All statistics are approximate and generated based on data transformed to a customised Albers equal-area projection, thus allowing wetland extent change for different regions of Queensland to be comparable.
Areas may change over time as mapping approaches improve.
Totals may not match the sum of individually displayed figures due to the rounding of displayed figures.
Wetland extent changes
| System | 2021 area (ha) |
2019 area (ha) |
2017 area (ha) |
2013 area (ha) |
2009 area (ha) |
2005 area (ha) |
2001 area (ha) |
pre-clear area (ha) |
2021/pre-clear percentage |
|---|---|---|---|---|---|---|---|---|---|
| Total | 15,674 | 15,657 | 15,659 | 15,661 | 15,671 | 15,677 | 15,677 | 15,967 | * 98.1% |
| Artificial and highly modified | 2 | 2 | 2 | 2 | 2 | 2 | 2 | 0 | n/a |
| Intertidal (saltmarsh, saltflats, mangroves) (natural) | 15,183 | 15,167 | 15,169 | 15,170 | 15,180 | 15,186 | 15,185 | 15,453 | 98.3% |
| Intertidal (saltmarsh, saltflats, mangroves) (slightly modified) | < 1 | < 1 | < 1 | < 1 | < 1 | < 1 | < 1 | 0 | n/a |
| Lacustrine (natural) | 0 | 0 | 0 | 0 | 0 | 0 | 0 | 0 | n/a |
| Lacustrine (slightly modified) | 0 | 0 | 0 | 0 | 0 | 0 | 0 | 0 | n/a |
| Lacustrine (unknown degree of modification) | 0 | 0 | 0 | 0 | 0 | 0 | 0 | 0 | n/a |
| Palustrine (natural) | 469 | 469 | 469 | 470 | 470 | 470 | 470 | 494 | 95.1% |
| Palustrine (slightly modified) | < 1 | < 1 | < 1 | < 1 | < 1 | < 1 | < 1 | 0 | n/a |
| Riverine | 18 | 18 | 18 | 18 | 18 | 18 | 18 | 21 | 87.9% |
| Intertidal (saltmarsh, saltflats, mangroves) (highly modified) | 0 | 0 | 0 | 0 | 0 | 0 | 0 | 0 | n/a |
| Intertidal (saltmarsh, saltflats, mangroves) (natural) | 15,183 | 15,167 | 15,169 | 15,170 | 15,180 | 15,186 | 15,185 | 15,453 | 98.3% |
| Intertidal (saltmarsh, saltflats, mangroves) (slightly modified) | < 1 | < 1 | < 1 | < 1 | < 1 | < 1 | < 1 | 0 | n/a |
| Lacustrine (artificial) | < 1 | < 1 | < 1 | < 1 | < 1 | < 1 | < 1 | 0 | n/a |
| Lacustrine (highly modified) | 2 | 2 | 2 | 2 | 2 | 2 | 2 | 0 | n/a |
| Lacustrine (natural) | 0 | 0 | 0 | 0 | 0 | 0 | 0 | 0 | n/a |
| Lacustrine (slightly modified) | 0 | 0 | 0 | 0 | 0 | 0 | 0 | 0 | n/a |
| Lacustrine (unknown degree of modification) | 0 | 0 | 0 | 0 | 0 | 0 | 0 | 0 | n/a |
| Palustrine (artificial) | 0 | 0 | 0 | 0 | 0 | 0 | 0 | 0 | n/a |
| Palustrine (highly modified) | 0 | 0 | 0 | 0 | 0 | 0 | 0 | 0 | n/a |
| Palustrine (natural) | 469 | 469 | 469 | 470 | 470 | 470 | 470 | 494 | 95.1% |
| Palustrine (slightly modified) | < 1 | < 1 | < 1 | < 1 | < 1 | < 1 | < 1 | 0 | n/a |
| Riverine (artificial) | 0 | 0 | 0 | 0 | 0 | 0 | 0 | 0 | n/a |
| Riverine (highly modified) | 0 | 0 | 0 | 0 | 0 | 0 | 0 | 0 | n/a |
| Riverine (natural) | 18 | 18 | 18 | 18 | 18 | 18 | 18 | 21 | 87.9% |
| Riverine (slightly modified) | 0 | 0 | 0 | 0 | 0 | 0 | 0 | 0 | n/a |
* Total 2021/pre-clear percentage excludes artificial and highly modified
![]() View 2021 wetland system extents for all marine parks (Queensland)
View 2021 wetland system extents for all marine parks (Queensland)
![]() View 2019 wetland system extents for all marine parks (Queensland)
View 2019 wetland system extents for all marine parks (Queensland)
![]() View 2017 wetland system extents for all marine parks (Queensland)
View 2017 wetland system extents for all marine parks (Queensland)
![]() View 2013 wetland system extents for all marine parks (Queensland)
View 2013 wetland system extents for all marine parks (Queensland)
![]() View 2009 wetland system extents for all marine parks (Queensland)
View 2009 wetland system extents for all marine parks (Queensland)
![]() View 2005 wetland system extents for all marine parks (Queensland)
View 2005 wetland system extents for all marine parks (Queensland)
![]() View 2001 wetland system extents for all marine parks (Queensland)
View 2001 wetland system extents for all marine parks (Queensland)
![]() View pre-clear wetland system extents for all marine parks (Queensland)
View pre-clear wetland system extents for all marine parks (Queensland)
![]() View 2021/pre-clear wetland system extent percentages for all marine parks (Queensland)
View 2021/pre-clear wetland system extent percentages for all marine parks (Queensland)
| Habitat | 2021 area (ha) |
2019 area (ha) |
2017 area (ha) |
2013 area (ha) |
2009 area (ha) |
2005 area (ha) |
2001 area (ha) |
|---|---|---|---|---|---|---|---|
| Total | 15,581 | 15,575 | 15,577 | 15,578 | 15,589 | 15,594 | 15,594 |
| Mangroves - Casuarina | 588 | 563 | 563 | 562 | 562 | 562 | 561 |
| Mangroves - other | 12,465 | 11,841 | 11,843 | 11,843 | 11,847 | 11,849 | 11,848 |
| Salt marsh and salt flats | 2,059 | 2,702 | 2,702 | 2,704 | 2,711 | 2,713 | 2,714 |
| Arid and semi-arid saline lake | 0 | 0 | 0 | 0 | 0 | 0 | 0 |
| Arid and semi-arid floodplain lake | 0 | 0 | 0 | 0 | 0 | 0 | 0 |
| Arid and semi-arid permanently inundated lake | 0 | 0 | 0 | 0 | 0 | 0 | 0 |
| Coastal and sub-coastal floodplain lake | 0 | 0 | 0 | 0 | 0 | 0 | 0 |
| Coastal and sub-coastal non-floodplain rock lake | 0 | 0 | 0 | 0 | 0 | 0 | 0 |
| Coastal and sub-coastal non-floodplain sand (window) lake | 0 | 0 | 0 | 0 | 0 | 0 | 0 |
| Coastal and sub-coastal non-floodplain sand (perched) lake | 0 | 0 | 0 | 0 | 0 | 0 | 0 |
| Coastal and sub-coastal non-floodplain soil lake | 0 | 0 | 0 | 0 | 0 | 0 | 0 |
| Arid and semi-arid saline swamp | 0 | 0 | 0 | 0 | 0 | 0 | 0 |
| Arid and semi-arid floodplain tree swamp | 0 | 0 | 0 | 0 | 0 | 0 | 0 |
| Arid and semi-arid floodplain shrub swamp | 0 | 0 | 0 | 0 | 0 | 0 | 0 |
| Arid and semi-arid floodplain grass, sedge and herb swamp | 0 | 0 | 0 | 0 | 0 | 0 | 0 |
| Arid and semi-arid non-floodplain tree swamp | 0 | 0 | 0 | 0 | 0 | 0 | 0 |
| Arid and semi-arid non-floodplain shrub swamp | 0 | 0 | 0 | 0 | 0 | 0 | 0 |
| Arid and semi-arid non-floodplain grass, sedge and herb swamp | 0 | 0 | 0 | 0 | 0 | 0 | 0 |
| Arid and semi-arid other non-floodplain swamp | 0 | 0 | 0 | 0 | 0 | 0 | 0 |
| Arid and semi-arid Great Artesian Basin fed spring swamp | 0 | 0 | 0 | 0 | 0 | 0 | 0 |
| Coastal and sub-coastal non-floodplain tree (Melaleuca and Eucalypt) swamp | 86 | 86 | 86 | 86 | 86 | 86 | 87 |
| Coastal and sub-coastal non-floodplain wet heath swamp | 6 | 6 | 6 | 6 | 6 | 6 | 6 |
| Coastal and sub-coastal non-floodplain grass, sedge, and herb swamp | 18 | 18 | 18 | 18 | 18 | 18 | 18 |
| Coastal and sub-coastal other non-floodplain swamp | 0 | 0 | 0 | 0 | 0 | 0 | 0 |
| Coastal and sub-coastal floodplain tree (Melaleuca and Eucalypt) swamp | 358 | 358 | 358 | 359 | 358 | 359 | 359 |
| Coastal and sub-coastal floodplain grass, sedge, and herb swamp | < 1 | < 1 | < 1 | < 1 | < 1 | < 1 | < 1 |
| Coastal and sub-coastal floodplain wet heath swamp | < 1 | < 1 | < 1 | < 1 | < 1 | < 1 | < 1 |
| Coastal and sub-coastal other floodplain swamp | 0 | 0 | 0 | 0 | 0 | 0 | 0 |
| Coastal and sub-coastal tree (palm) swamp | 0 | 0 | 0 | 0 | 0 | 0 | 0 |
| Unknown - Swamp - Arid and semi-arid | 0 | 0 | 0 | 0 | 0 | 0 | 0 |
| Unknown - Swamp - Coastal and sub-coastal | 0 | 0 | 0 | 0 | 0 | 0 | 0 |
| Mangroves - Casuarina (natural) | 588 | 563 | 563 | 562 | 562 | 562 | 561 |
| Mangroves - Casuarina (slightly modified) | 0 | 0 | 0 | 0 | 0 | 0 | 0 |
| Mangroves - other (natural) | 12,464 | 11,840 | 11,842 | 11,842 | 11,846 | 11,848 | 11,848 |
| Mangroves - other (slightly modified) | < 1 | < 1 | < 1 | < 1 | < 1 | < 1 | < 1 |
| Salt marsh and salt flats (natural) | 2,059 | 2,702 | 2,702 | 2,704 | 2,711 | 2,713 | 2,714 |
| Salt marsh and salt flats (slightly modified) | < 1 | < 1 | < 1 | < 1 | < 1 | < 1 | < 1 |
| Arid and semi-arid saline lake (natural) | 0 | 0 | 0 | 0 | 0 | 0 | 0 |
| Arid and semi-arid saline lake (slightly modified) | 0 | 0 | 0 | 0 | 0 | 0 | 0 |
| Arid and semi-arid floodplain lake (natural) | 0 | 0 | 0 | 0 | 0 | 0 | 0 |
| Arid and semi-arid floodplain lake (slightly modified) | 0 | 0 | 0 | 0 | 0 | 0 | 0 |
| Arid and semi-arid permanently inundated lake (slightly modified) | 0 | 0 | 0 | 0 | 0 | 0 | 0 |
| Coastal and sub-coastal floodplain lake (natural) | 0 | 0 | 0 | 0 | 0 | 0 | 0 |
| Coastal and sub-coastal floodplain lake (slightly modified) | 0 | 0 | 0 | 0 | 0 | 0 | 0 |
| Coastal and sub-coastal non-floodplain rock lake (natural) | 0 | 0 | 0 | 0 | 0 | 0 | 0 |
| Coastal and sub-coastal non-floodplain rock lake (slightly modified) | 0 | 0 | 0 | 0 | 0 | 0 | 0 |
| Coastal and sub-coastal non-floodplain sand (window) lake (natural) | 0 | 0 | 0 | 0 | 0 | 0 | 0 |
| Coastal and sub-coastal non-floodplain sand (window) lake (slightly modified) | 0 | 0 | 0 | 0 | 0 | 0 | 0 |
| Coastal and sub-coastal non-floodplain sand (perched) lake (natural) | 0 | 0 | 0 | 0 | 0 | 0 | 0 |
| Coastal and sub-coastal non-floodplain soil lake (natural) | 0 | 0 | 0 | 0 | 0 | 0 | 0 |
| Coastal and sub-coastal non-floodplain soil lake (slightly modified) | 0 | 0 | 0 | 0 | 0 | 0 | 0 |
| Arid and semi-arid saline swamp (natural) | 0 | 0 | 0 | 0 | 0 | 0 | 0 |
| Arid and semi-arid saline swamp (slightly modified) | 0 | 0 | 0 | 0 | 0 | 0 | 0 |
| Arid and semi-arid floodplain tree swamp (natural) | 0 | 0 | 0 | 0 | 0 | 0 | 0 |
| Arid and semi-arid floodplain tree swamp (slightly modified) | 0 | 0 | 0 | 0 | 0 | 0 | 0 |
| Arid and semi-arid floodplain shrub swamp (natural) | 0 | 0 | 0 | 0 | 0 | 0 | 0 |
| Arid and semi-arid floodplain shrub swamp (slightly modified) | 0 | 0 | 0 | 0 | 0 | 0 | 0 |
| Arid and semi-arid floodplain grass, sedge and herb swamp (natural) | 0 | 0 | 0 | 0 | 0 | 0 | 0 |
| Arid and semi-arid floodplain grass, sedge and herb swamp (slightly modified) | 0 | 0 | 0 | 0 | 0 | 0 | 0 |
| Arid and semi-arid non-floodplain tree swamp (natural) | 0 | 0 | 0 | 0 | 0 | 0 | 0 |
| Arid and semi-arid non-floodplain tree swamp (slightly modified) | 0 | 0 | 0 | 0 | 0 | 0 | 0 |
| Arid and semi-arid non-floodplain shrub swamp (natural) | 0 | 0 | 0 | 0 | 0 | 0 | 0 |
| Arid and semi-arid non-floodplain shrub swamp (slightly modified) | 0 | 0 | 0 | 0 | 0 | 0 | 0 |
| Arid and semi-arid non-floodplain grass, sedge and herb swamp (natural) | 0 | 0 | 0 | 0 | 0 | 0 | 0 |
| Arid and semi-arid non-floodplain grass, sedge and herb swamp (slightly modified) | 0 | 0 | 0 | 0 | 0 | 0 | 0 |
| Arid and semi-arid other non-floodplain swamp (natural) | 0 | 0 | 0 | 0 | 0 | 0 | 0 |
| Arid and semi-arid other non-floodplain swamp (slightly modified) | 0 | 0 | 0 | 0 | 0 | 0 | 0 |
| Arid and semi-arid Great Artesian Basin fed spring swamp (natural) | 0 | 0 | 0 | 0 | 0 | 0 | 0 |
| Arid and semi-arid Great Artesian Basin fed spring swamp (slightly modified) | 0 | 0 | 0 | 0 | 0 | 0 | 0 |
| Coastal and sub-coastal non-floodplain tree (Melaleuca and Eucalypt) swamp (natural) | 86 | 86 | 86 | 86 | 86 | 86 | 87 |
| Coastal and sub-coastal non-floodplain tree (Melaleuca and Eucalypt) swamp (slightly modified) | 0 | 0 | 0 | 0 | 0 | 0 | 0 |
| Coastal and sub-coastal non-floodplain wet heath swamp (natural) | 6 | 6 | 6 | 6 | 6 | 6 | 6 |
| Coastal and sub-coastal non-floodplain wet heath swamp (slightly modified) | 0 | 0 | 0 | 0 | 0 | 0 | 0 |
| Coastal and sub-coastal non-floodplain grass, sedge, and herb swamp (natural) | 18 | 18 | 18 | 18 | 18 | 18 | 18 |
| Coastal and sub-coastal non-floodplain grass, sedge, and herb swamp (slightly modified) | 0 | 0 | 0 | 0 | 0 | 0 | 0 |
| Coastal and sub-coastal other non-floodplain swamp (natural) | 0 | 0 | 0 | 0 | 0 | 0 | 0 |
| Coastal and sub-coastal other non-floodplain swamp (slightly modified) | 0 | 0 | 0 | 0 | 0 | 0 | 0 |
| Coastal and sub-coastal floodplain tree (Melaleuca and Eucalypt) swamp (natural) | 358 | 358 | 358 | 359 | 358 | 359 | 359 |
| Coastal and sub-coastal floodplain tree (Melaleuca and Eucalypt) swamp (slightly modified) | < 1 | < 1 | < 1 | < 1 | < 1 | < 1 | < 1 |
| Coastal and sub-coastal floodplain grass, sedge, and herb swamp (natural) | < 1 | < 1 | < 1 | < 1 | < 1 | < 1 | < 1 |
| Coastal and sub-coastal floodplain grass, sedge, and herb swamp (slightly modified) | 0 | 0 | 0 | 0 | 0 | 0 | 0 |
| Coastal and sub-coastal floodplain wet heath swamp (natural) | < 1 | < 1 | < 1 | < 1 | < 1 | < 1 | < 1 |
| Coastal and sub-coastal floodplain wet heath swamp (slightly modified) | 0 | 0 | 0 | 0 | 0 | 0 | 0 |
| Coastal and sub-coastal other floodplain swamp (natural) | 0 | 0 | 0 | 0 | 0 | 0 | 0 |
| Coastal and sub-coastal other floodplain swamp (slightly modified) | 0 | 0 | 0 | 0 | 0 | 0 | 0 |
| Coastal and sub-coastal tree (palm) swamp (natural) | 0 | 0 | 0 | 0 | 0 | 0 | 0 |
| Coastal and sub-coastal tree (palm) swamp (slightly modified) | 0 | 0 | 0 | 0 | 0 | 0 | 0 |
| Unknown - Swamp - Arid and semi-arid (natural) | 0 | 0 | 0 | 0 | 0 | 0 | 0 |
| Unknown - Swamp - Arid and semi-arid (slightly modified) | 0 | 0 | 0 | 0 | 0 | 0 | 0 |
| Unknown - Swamp - Coastal and sub-coastal (natural) | 0 | 0 | 0 | 0 | 0 | 0 | 0 |
| Unknown - Swamp - Coastal and sub-coastal (slightly modified) | 0 | 0 | 0 | 0 | 0 | 0 | 0 |
![]() View 2021 wetland habitat area for all marine parks (Queensland)
View 2021 wetland habitat area for all marine parks (Queensland)
![]() View 2019 wetland habitat area for all marine parks (Queensland)
View 2019 wetland habitat area for all marine parks (Queensland)
![]() View 2017 wetland habitat area for all marine parks (Queensland)
View 2017 wetland habitat area for all marine parks (Queensland)
![]() View 2013 wetland habitat area for all marine parks (Queensland)
View 2013 wetland habitat area for all marine parks (Queensland)
![]() View 2009 wetland habitat area for all marine parks (Queensland)
View 2009 wetland habitat area for all marine parks (Queensland)
![]() View 2005 wetland habitat area for all marine parks (Queensland)
View 2005 wetland habitat area for all marine parks (Queensland)
![]() View 2001 wetland habitat area for all marine parks (Queensland)
View 2001 wetland habitat area for all marine parks (Queensland)
Disclaimer
Areas do not include marine or estuarine waters but do include estuarine wetland vegetation
(e.g. mangroves and tidal flats).
All statistics are approximate and generated based on data transformed to a customised Albers equal-area projection, thus allowing wetland extent change for different regions of Queensland to be comparable.
Areas may change over time as mapping approaches improve.
Totals may not match the sum of individually displayed figures due to the rounding of displayed figures.
Australian Land Use and Management Classification (ALUMC) 
| ALUMC code and description | Area (ha) | % total area |
|---|---|---|
| Total | 19,386 | 5.7% |
| 6.5 Marsh/wetland | 10,937 | 3.2% |
| 6.5.0 Marsh/wetland | 9,934 | 2.9% |
| 6.5.1 Marsh/wetland - conservation | 977 | 0.3% |
| 6.5.2 Marsh/wetland - production | 27 | 0.0% |
| 1.1 Nature conservation | 4,666 | 1.4% |
| 1.1.3 National park | 2,927 | 0.9% |
| 1.1.4 Natural feature protection | 1,008 | 0.3% |
| 1.1.6 Protected landscape | 4 | 0.0% |
| 1.1.7 Other conserved area | 726 | 0.2% |
| 6.3 River | 2,038 | 0.6% |
| 6.3.0 River | 2,031 | 0.6% |
| 6.3.3 River - intensive use | 7 | 0.0% |
| 6.6 Estuary/coastal waters | 501 | 0.1% |
| 6.6.0 Estuary/coastal waters | 501 | 0.1% |
| 6.6.3 Estuary/coastal waters - intensive use | < 1 | 0.0% |
| 5.5 Services | 288 | 0.1% |
| 5.5.1 Commercial services | < 1 | 0.0% |
| 5.5.2 Public services | < 1 | 0.0% |
| 5.5.3 Recreation and culture | 287 | 0.1% |
| 1.3 Other minimal use | 245 | 0.1% |
| 1.3.0 Other minimal use | 123 | 0.0% |
| 1.3.3 Residual native cover | 122 | 0.0% |
| 6.1 Lake | 214 | 0.1% |
| 6.1.0 Lake | 214 | 0.1% |
| 2.2 Production native forests | 120 | 0.0% |
| 2.2.0 Production native forests | 120 | 0.0% |
| 5.4 Residential and farm infrastructure | 98 | 0.0% |
| 5.4.1 Urban residential | 77 | 0.0% |
| 5.4.2 Rural residential with agriculture | 4 | 0.0% |
| 5.4.3 Rural residential without agriculture | 17 | 0.0% |
| 2.1 Grazing native vegetation | 96 | 0.0% |
| 2.1.0 Grazing native vegetation | 96 | 0.0% |
| 1.2 Managed resource protection | 92 | 0.0% |
| 1.2.0 Managed resource protection | 92 | 0.0% |
| 5.7 Transport and communication | 77 | 0.0% |
| 5.7.0 Transport and communication | < 1 | 0.0% |
| 5.7.1 Airports/aerodromes | 71 | 0.0% |
| 5.7.2 Roads | 3 | 0.0% |
| 5.7.4 Ports and water transport | 2 | 0.0% |
| 3.6 Land in transition | 6 | 0.0% |
| 3.6.0 Land in transition | 6 | 0.0% |
| 5.9 Waste treatment and disposal | 2 | 0.0% |
| 5.9.5 Sewage | 2 | 0.0% |
| 3.1 Plantation forests | 2 | 0.0% |
| 3.1.0 Plantation forests | 2 | 0.0% |
| 5.2 Intensive animal production | 2 | 0.0% |
| 5.2.5 Aquaculture | 2 | 0.0% |
| 5.2.6 Horse studs | < 1 | 0.0% |
| 3.3 Cropping | < 1 | 0.0% |
| 3.3.5 Sugar | < 1 | 0.0% |
| 5.3 Manufacturing and industrial | < 1 | 0.0% |
| 5.3.0 Manufacturing and industrial | < 1 | 0.0% |
| 4.4 Irrigated perennial horticulture | < 1 | 0.0% |
| 4.4.0 Irrigated perennial horticulture | < 1 | 0.0% |
| 4.3 Irrigated cropping | < 1 | 0.0% |
| 4.3.0 Irrigated cropping | < 1 | 0.0% |
| 5.1 Intensive horticulture | < 1 | 0.0% |
| 5.1.0 Intensive horticulture | < 1 | 0.0% |
| 4.5 Irrigated seasonal horticulture | < 1 | 0.0% |
| 4.5.0 Irrigated seasonal horticulture | < 1 | 0.0% |
Drainage divisions 
Drainage basins
Drainage sub-basins
Regional natural resource management (NRM) bodies
Local government areas
100K map tiles
Climate zones
 Subtropical
Bioregions
Biogeographic subregions
IBRA bioregions
IBRA subregions
Bioregional assessment areas
Marine meso-scale bioregions
- Tweed-Moreton (TM)
Marine provincial bioregions
- Central Eastern Shelf Transition
Regional plans
World Heritage areas
Ramsar internationally important wetlands
DIWA nationally important wetlands
National parks
Study areas
Report cards
-
Healthy Land and Water
- Bribie Island (Healthy Land and Water)
- Broadwater (Healthy Land and Water)
- Caboolture (Healthy Land and Water)
- Central Bay (Healthy Land and Water)
- Eastern Bay (Healthy Land and Water)
- Logan (Healthy Land and Water)
- Lower Brisbane (Healthy Land and Water)
- Moreton Island (Healthy Land and Water)
- North Stradbroke Island (Healthy Land and Water)
- Pimpama-Coomera (Healthy Land and Water)
- Pine (Healthy Land and Water)
- Pumicestone (Healthy Land and Water)
- Pumicestone Passage (Healthy Land and Water)
- Redland (Healthy Land and Water)
- South Stradbroke Island (Healthy Land and Water)
- Southern Bay (Healthy Land and Water)
- Western Bay (Healthy Land and Water)
Conservation parks
- Beachmere Conservation Park
- Bird Island Conservation Park
- Buckleys Hole Conservation Park
- Bullock Creek Conservation Park
- Cabbage Tree Point Conservation Park
- Deception Bay Conservation Park
- Goat Island Conservation Park
- Hays Inlet Conservation Park 1
- Hays Inlet Conservation Park 2
- King Island Conservation Park
- Main Beach Conservation Park
- Mud Island Conservation Park
- Myora Conservation Park
- Ningi Creek Conservation Park
- South Stradbroke Island Conservation Park
- Teerk Roo Ra Conservation Park
State forests
Forest reserves
Resources reserves
Timber reserves
Fish habitat areas
Coastal management district
- Available (all have been combined since February 2012)
Nature refuges
Freshwater biogeographic provinces
Aquatic Conservation Assessments (AquaBAMM) and others
Wetland (aquatic ecosystem) type—conceptual models
- Coastal and subcoastal floodplain grass, sedge, herb swamp
- Coastal and subcoastal floodplain tree swamp–Melaleuca spp. and Eucalyptus spp.
- Coastal and subcoastal floodplain wet heath swamp
- Coastal and subcoastal non-floodplain grass sedge and herb swamp
- Coastal and subcoastal non-floodplain tree swamp—Melaleuca spp. and Eucalyptus spp.
- Coastal and subcoastal non-floodplain wet heath swamp
Wetland (aquatic ecosystem) type—management profiles
Groundwater dependent ecosystem type—conceptual models
Healthy Land and Water conceptual models
Water resource planning areas
Aquatic ecosystem monitoring programs
- Aerial surveys of waterbirds in eastern Australia
- Ecosystem health monitoring program – estuarine and marine
- Environmental flows assessment program (EFAP)
- Framework for the assessment of river and wetland health (FARWH) – Queensland trials
- Groundwater ambient network (GWAN) – water quality
- Groundwater water level network
- Long term historical trend water quality monitoring data
- Lyngbya monitoring program
- Moreton Bay mangroves
- Moreton Bay marine park monitoring program
- Moreton Bay regional council waterway health monitoring program
- Queensland wetland mapping
- South East Queensland (SEQ) Catchments community water quality monitoring program
- Surface water monitoring network
Point source monitoring
Wetland soil indicator case studies
Wetland management case studies
Wetland projects
- Deadly Science
- Integrated Sunshine Coast Clean-up project
- Newport Waterways entrance channel offset - rehabilitation Uhlmann Road sewage treatment plant site
- Promoting sustainable vegetation management and ecosystem resilience on Coochiemudlo Island
- Pumicestone Passage Water and Mangrove Monitoring
- Silcock Street, Hays Inlet weed control
- Underwater Clean-Up of Curtain Artificial Reef
- Wynnum North Reserve Restoration
Area specific conceptual model case studies
Paddock to Reef (P2R) report cards
Water Quality Improvement Plan catchments
EPP (Water) scheduled environmental values and water quality objectives
Shorebird zones
Biopassage structures
Related legislation/policies
External links/description
Wildlife
|
Kingdom
Class
|
Native | Introduced | Wetland indicator species |
Rare or threatened species |
All |
|---|---|---|---|---|---|
| TOTAL | 3,731 | 686 | 518 | 139 | 4,418 |
| Animals | 991 | 43 | 259 | 92 | 1,034 |
| Mammals | 107 | 16 | 9 | 12 | 123 |
| Birds | 495 | 11 | 101 | 52 | 506 |
| Reptiles | 108 | 2 | 16 | 8 | 110 |
| Amphibians | 39 | 1 | 17 | 7 | 40 |
| Lobe-finned fishes | 1 | 0 | 1 | 1 | 1 |
| Ray-finned fishes | 56 | 10 | 65 | 4 | 66 |
| Cartilaginous fishes | 20 | 0 | 20 | 2 | 20 |
| Lampreys | 1 | 0 | 1 | 1 | 1 |
| Insects | 155 | 3 | 29 | 3 | 158 |
| Malacostracans | 8 | 0 | 0 | 2 | 8 |
| Snails | 1 | 0 | 0 | 0 | 1 |
| Bacteria | 35 | 0 | 0 | 0 | 35 |
| Chromists | 73 | 0 | 0 | 0 | 73 |
| Fungi | 528 | 0 | 0 | 0 | 528 |
| Plants | 2,102 | 643 | 259 | 47 | 2,746 |
| Protozoans | 2 | 0 | 0 | 0 | 2 |
Note: Wildlife statistics are based on information that has been submitted to the DETSI WildNet database and converted to a 10km² grid. The grid information has been intersected with the mapping polygons to determine the species lists. Click here to view the species grid metadata.
Information from WildNet can also be accessed via Wildlife Online and WetlandMaps.
Rare or threatened includes species listed as extinct, extinct in the wild, critically endangered, endangered, vulnerable or conservation dependent under either the Nature Conservation Act or Environment Protection and Biodiversity Conservation Act
Disclaimer: While every care is taken to ensure the accuracy of this product, the Queensland Government and Australian Government make no representations or warranties about its accuracy, reliability, completeness or suitability for any particular purpose and disclaim all responsibility and all liability (including without limitation, liability in negligence) for all expenses, losses, damages (including indirect or consequential damage) and costs which might be incurred as a consequence of reliance on the product, or as a result of the product being inaccurate or incomplete in any way and for any reason.
This page should be cited as:
Department of Environment, Science and Innovation, Queensland (2024) Moreton Bay Marine Park — facts and maps, WetlandInfo website, accessed 8 May 2025. Available at: https://wetlandinfo.des.qld.gov.au/wetlands/facts-maps/marine-park-moreton-bay/

 — Department of the Environment, Tourism, Science and Innovation